data visualisation
-
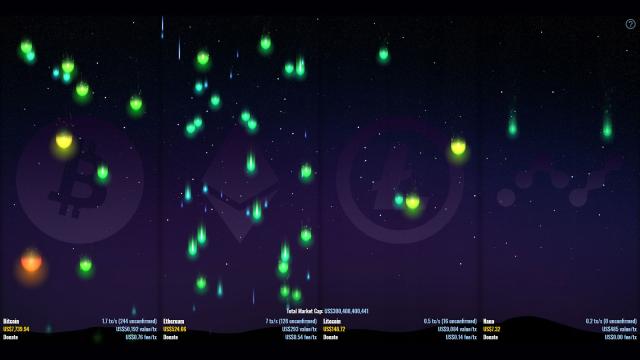
Watch Live Cryptocurrency Transactions Visualised As A Beautiful Meteor Storm

Viewing the world of cryptocurrency via a block explorer isn’t exactly exciting. That’s what data visualisations are for — the transformation boring bits and bytes into something pretty. CryptoLights is a website that takes Bitcoin, Litecoin, Ethereum and Nano transactions and turns them into a glowing digital meteor storm.
-
Beautiful Visualisation Charts History’s Best Chess Players

Since the early 19th century, many chess grandmasters have come and gone, some better than others. This elegant data visualisation by Abacaba shows which players were the very best, and how long they were able to maintain their dominance.

-
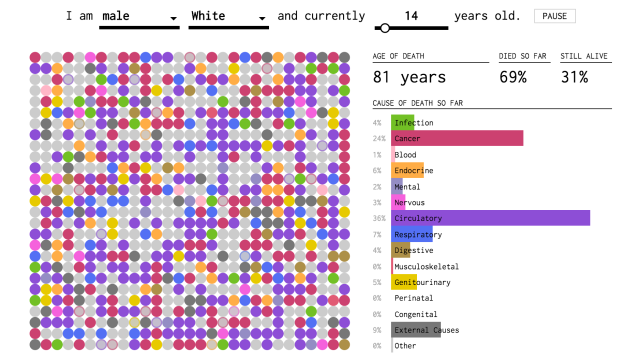
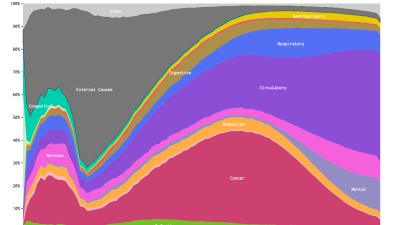
When You’ll Probably Die, Visualised

You’ve already found out how you might die — but when’s it going to happen? This visualisation of data from the US Centres for Disease Control and Prevention should give you a better idea.
-
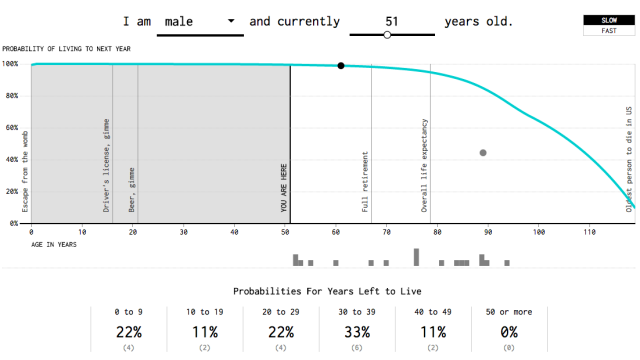
Data Visualisation Predicts When You’re Going To Die
It’s a morbid question but one that we humans tend to obsess over: When am I going to die? Only a highly trained Seer can give you a firm answer, but if you want cold hard statistics, we Muggles have that bit covered.