It’s an age-old question, like cats or dogs, Kirk or Picard? PlayStation or Xbox? All tough questions with equally tough answers, and the same can be said for LCD versus OLED televisions.
An impressive new generation of TVs with the very latest advanced display technologies launching in 2015 include the newest state-of-the-art large screen OLED displays and LCDs with Quantum Dots and Full Array Local Dimming, plus a new wide DCI Colour Gamut, 4K Ultra HD resolution, and curved screens.
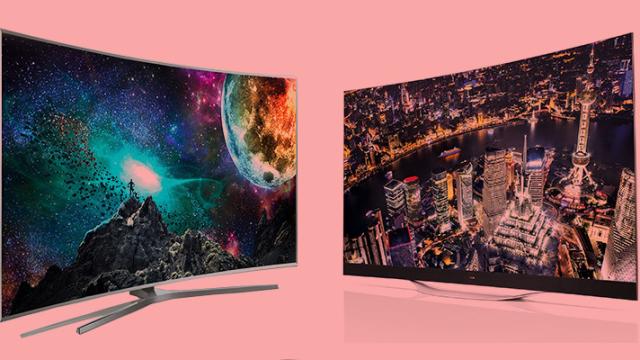
To explore these new OLED and LCD TV technologies in-depth we have lab tested, analysed, and compared side-by-side two 2015 flagship top-of-the-line TVs from LG and Samsung that have competing display technologies. Both are 65 inch 4K Ultra HD DCI Colour Gamut curved screen TVs — an LG OLED TV (model 65EG9600) and a Samsung LCD TV (model UN65JS9500).
Dual Content Standards
While both these TVs have the latest next generation display hardware, the available consumer content produced for 4K Ultra HD with the DCI Colour Gamut is still very scarce. In 2015 over 99 per cent of all currently available consumer content is for the existing Full HD resolution with its own sRGB / Rec.709 Standard and Colour Gamut. So it is essential that these latest TVs can also accurately display the large base of existing Full HD content with excellent picture quality. This content not only includes Over The Air (OTA), Cable, and Satellite TV broadcasting, but also Blu-ray, DVD, digital camera, web content, internet streaming, and computer content, including photos, videos and movies, which are all based on the sRGB / Rec.709 Gamut and Standard. It will take years to build up a content base for 4K Ultra HD with the DCI Colour Gamut, which will become available first through internet streaming. So we have also measured how well these TVs reproduce the current Full HD content that everyone is watching now.
There are No LED TVs!
There is still a lot of consumer confusion regarding LED TVs versus OLED TVs… The first thing we need to clear up is the widespread misunderstanding created by the marketing of “LED TVs” — there aren’t any! The so-called LED TVs are just LCD TVs that have a backlight that is made of white LED lights. The LEDs are not the display, just the backlight, nothing more! OLEDs are an entirely different class of emissive imaging display technology (that doesn’t use a backlight). Unfortunately, many people think they already have an LED/OLED TV at home, but they actually have an LCD TV…
Overview of the Existing and Newest TVs and Standards
If you have a reasonably up-to-date TV purchased within the last 5 years, you most likely have a Full HD 1920×1080 pixel resolution flat screen LCD or Plasma TV with an sRGB / Rec.709 Standard and Colour Gamut. Screen size has also been increasing quickly, with 60 inches and above the new large screen high-end, and getting larger. Many of the new screens are also slightly curved — we’ll explain the advantages below.
The newest TVs have an Ultra HD 3840×2160 pixel resolution, also called 4K, which is twice the resolution of Full HD and has 4 times the number of pixels. The new DCI (Digital Cinema Initiative) Colour Gamut is 26 per cent larger than the current sRGB / Rec.709 Colour Gamut, with more saturated Red and Green Primaries. Ultra HD TVs need 90 per cent of DCI Gamut. But please note that a UHD TV cannot increase the picture resolution or the Colour Gamut of any earlier non-UHD picture content (regardless of what any sales person tells you). We will examine these issues in detail below.
Latest OLED TV Technology
OLEDs are thin solid state devices that directly emit coloured light. OLED displays have been improving rapidly with increasing screen size, peak brightness, and power efficiency. They don’t need a backlight and supporting optical components so they are considerably thinner and lighter than LCD displays. As a result, OLED TVs are considerably thinner (with the screen just 0.2 inches deep for this 65 inch model) and considerably lighter than LCD TVs — the tested LCD TV is 52 per cent heavier than the OLED TV (without their metal stands). It is also easier to make OLEDs with curved screens, which we will explain below.
OLED displays first appeared in consumer products in 2010 on smartphones with 4 inch screens. Making a large TV size OLED display is considerably more challenging, so that took a few years more. LG introduced their first generation 55 inch Full HD OLED TV in 2013, which was the best TV display we had ever tested up to then — and almost all reviewers agreed that OLED outperformed the best Plasma and LCD TVs in producing the very highest picture quality. The LG OLED TV that we test here is not only larger but also has even better display performance and picture quality.
LG has implemented some special OLED technology for their TVs. First of all, rather than laying out three separate sets of OLED Red, Green, and Blue sub-pixels throughout the screen, the LG TV instead has a single uniform set of OLED White sub-pixels throughout made as a combined stack of Red, Green, and Blue OLED colours for each sub-pixel. The sub-pixels then each have their own individual Red, Green and Blue colour filters that select the specific Red, Green or Blue OLED colour for that sub-pixel. This approach greatly simplifies the OLED production, improves yields, and lowers the manufacturing costs. In addition, LG has also added a 4th clear sub-pixel to every pixel that just produces pure White. This increases the display’s power efficiency and also improves colour accuracy and colour management.
Latest LCD TV Technology
Samsung also introduced their first generation OLED TV in 2013, but for the 2015 models they decided to go back to LCDs, most likely due to OLED manufacturing costs and yields, and to concentrate on the production of smaller mobile OLED displays.
The Samsung flagship LCD TV that we test here includes the latest high-end LCD technology, including Full Array Local Dimming to improve the LCD’s Black Levels, Quantum Dots (which Samsung generically calls Nano-crystals) to enlarge the Colour Gamut and improve display power efficiency, and a curved screen, which is rather challenging to produce for LCDs.
One rather surprising component for this top-of-the-line TV is that Samsung is using an LCD panel with PVA LCD technology instead of IPS, FFS, or PLS LCD technology, which many consumers know are used in the best and highest performing LCD smartphones, tablets, and monitors because of their excellent wide viewing angle performance with small colour and contrast changes with viewing angle. Large screen TVs are often watched by multiple viewers from a wide range of viewing angles, so the wide viewing angles together with the larger DCI Colour Gamut can be expected to produce larger picture quality colour and contrast changes with viewing angle, which we measured and analyse in-depth below.
Results Highlights
In this Results section we provide Highlights of the comprehensive DisplayMate Lab tests and measurements and extensive visual comparisons using test photos, test images, and test patterns that are covered in the advanced sections.
4K Ultra HD Resolution
Both of the TVs have Ultra HD 3840×2160 pixel resolution, also called 4K, which is twice the resolution of Full HD and has 4 times the number of pixels. The perceived image sharpness that your eyes actually see depends primarily on your viewing distance to the screen, and also how good your vision is — the further away you are the lower the image sharpness that you’ll see. In addition, the viewing conditions like the level of ambient light and your viewing position and angle can significantly lower image sharpness. For typical viewing distances Full HD TVs deliver very sharp images — for Ultra HD the TV display will appear perfectly sharp even if you have much better than standard 20/20 Vision. This article covers the sharpness and resolution issue in greater detail.
If the Ultra HD TV receives content with lower resolution Full HD (1920×1080) or HD (1280×720) or SD (852×480) the TV’s internal electronic signal processing will automatically upscale and convert the image content up to 3840×2160 so that it fills the screen. However, something that is also widely misunderstood, even after upscaling the actual on-screen image resolution remains the same as the lower resolution original content because up-scaling cannot provide any additional high resolution image detail that is not present in the original image. So all Full HD content remains a Full HD image and is not Ultra HD after upscaling.
Real Viewing Conditions with Ambient Light and Large Viewing Angles
To see the best picture quality on any display or any TV requires ideal viewing conditions, which includes watching in absolute darkness with no ambient light, and watching from a viewing position directly in front of the center of the screen, called the “Sweet Spot.” TVs are almost never watched under these ideal viewing conditions. First of all, the screen reflects any ambient light, which reduces and washes out the picture contrast and colours, and also reduces the perceived image sharpness.
Second, since only one person at a time can watch from the central Sweet Spot, how the picture quality changes (degrades) with viewing position and viewing angle is extremely important. Both of these real world viewing conditions have a major impact on picture quality — we’ll examine them both with detailed measurements. We’ll cover the Viewing Angle issues last so they can each be compared with the ideal 0 degrees Viewing Angle performance we examine first. Be forewarned that the Samsung LCD TV shows large viewing angle changes, which we’ll cover in detail below…
Curved Screens
Both TVs have curved screens, which first appeared on OLED and LCD production TVs in 2013, but the curvature is actually relatively small, only about 2.1 inches (5.3 cm) in-depth (from the edge to the screen center) on these 65 inch TVs. This slight curvature has a real purpose — it significantly reduces the reflections of ambient light from the screen, which improves image contrast, and it also reduces the (keystone) optical distortion in the screen image geometry, particularly away from the central Sweet Spot at larger viewing angles.
Because the screen curvature is small, it is barely noticeable when watching the screen from normal viewing distances, particularly in low ambient light, which is ideal for watching TV. Since we are accustomed to watching perfectly flat screens some people don’t like the change in screen geometry — fortunately many high-end TVs are available with curved or flat screens. Whether you prefer a curved or flat screen is primarily subjective, but a slightly curved screen does provide several important objective optimal visual advantages, which are explained in detail in this earlier article.
Picture Modes
All high-end TVs include a number of user selectable Picture Modes, each with different intended viewing conditions and applications that provide different colour, brightness, contrast and calibration settings, and selectable picture processing options. The LG OLED TV has 8 selectable modes and the Samsung LCD TV has 4 modes. We will analyse the two most important ones: the native display mode that delivers the highest brightness, contrast, and colour saturation, called the Vivid mode on the LG OLED TV and the Dynamic mode on the Samsung LCD TV, and the mode that delivers the most accurate colours and picture quality that is preferred by videophiles, called the Cinema mode on the LG OLED TV and the Movie mode on the Samsung LCD TV. We include measurements and analysis for both modes on each TV. For all of the tests and measurements we used the manufacturer’s default factory settings for each of the modes and did not make any additional changes or adjustments.
Picture Brightness
High picture brightness for TVs is considered important by most consumers because TVs are viewed under a wide range of ambient lighting conditions, and the high image brightness helps to compensate for the reduction in picture contrast and colour saturation from the ambient light that is reflected off the screen. Under ideal dark viewing conditions (like in movie theatres) relatively low picture brightness is all that is needed.
Both TVs deliver bright images for typical TV picture content, which have Average Picture Levels (APL) of 25 per cent or less (compared to an all white screen). The Cinema and Movie modes are designed for viewing in lower ambient lighting, so they aren’t as bright as the Vivid and Dynamic modes. While OLEDs were at one time less bright and less power efficient than LCDs, their brightness and power efficiency are now typically higher. The visual brightness (Luminance) is measured in terms of cd/m2, which is often referred to as nits.
The brightness for both TVs is affected by the Average Picture Level (average brightness over the screen) of the picture content. For high APLs, which can occur with some web and computer content that has lots of white backgrounds for text, the OLED brightness decreases to 157 to 232 nits for 50 per cent APL, and for an all peak white screen, which has 100 per cent APL, it falls to 91 to 141 nits. Most TV picture content has an APL under 25 per cent. Since the screens are fairly large, they will produce a lot of light with high APL images, so the reduced screen brightness at high APLs might actually be more comfortable visually with large screens.
The brightness (Luminance) for LCD displays generally doesn’t vary with APL. However, with Local Dimming the maximum brightness within a zone on the screen is reduced whenever Local Dimming is applied to that zone. For very low APLs with Local Dimming the peak brightness can decrease to below 100 nits in order to produce a Black that is 4 times darker in a zone. We examine LCD Local Dimming in detail below. See the Brightness and Contrast section for measurements and details. The Brightness also varies significantly with Viewing Angle, see below.
Display Black Levels and Contrast Ratios
OLEDs are light emissive displays that produce perfect image Blacks with 0 cd/m2 Black Levels resulting in an infinite Contrast Ratio and an infinite Dynamic Range. This is visually striking with darker picture content, and with letterboxing the outer borders are invisible for a nice effect.
LCDs are light transmissive displays that cannot fully block the backlight so they produce very dark grays instead of perfect Blacks. This results in native Contrast Ratios (peak white to actual black) in the range of 1,000 to 4,000 for LCDs. For bright picture content the dark grey blacks normally aren’t noticeable, but with darker picture content the dark grey background glow can be quite noticeable and it diminishes both the picture contrast and colour saturation.
Different LCD technologies have different Black Levels and native Contrast Ratios. For the Samsung LCD TV we measured an impressive native Contrast Ratio of 3,844 the highest ever for an LCD. But that still results in a Black Level of 0.1 nits, which visually stands out in darker picture content. These Black Levels can be significantly reduced by selectively dimming the backlight when there is darker picture content with a technology called Local Dimming, which we examine in detail below and also in the Viewing Tests. See the Brightness and Contrast section for measurements and details. The LCD Black Levels and Contrast Ratios also vary significantly with Viewing Angle, see below.
Low Screen Reflectance
The screens on all displays are mirrors that reflect light from everything that is illuminated anywhere in front of the screen (especially anything behind the viewers), including lamps, ceiling lights, windows, direct and indirect indoor and outdoor sunlight, which washes out the on-screen colours, degrades image contrast, and interferes with seeing the on-screen images. The lower the Screen Reflectance the better. In fact, decreasing the Screen Reflectance by 50 per cent doubles the effective Contrast Ratio in Ambient Light, so it is very important.
Most TVs, monitors, smartphones and tablets have a Screen Reflectance of 5 per cent or more. The previous Low Reflectance record holders that we measured were the 2013 LG OLED TV at 2.2 per cent and the Apple iPad Air 2 Tablet at 2.5 per cent. The new LG OLED TV breaks all previous records, with a very impressive 1.2 per cent Reflectance, the lowest we have ever measured for a display. The Samsung LCD TV also does very well, with an impressive 2.2 per cent Reflectance. However, as a result of its much lower Reflectance, the LG OLED TV has about double the effective Contrast and Contrast Rating for High Ambient Light as the Samsung LCD TV. See the Screen Reflections and Brightness and Contrast sections for measurements and details.
LCD Local Dimming
The Samsung LCD TV also includes advanced Full Array Local Dimming, which can visually improve the Black brightness levels of LCDs. With this technology the TV backlight is divided into approximately 180 independently dimmable zones (18×10) that allow dark areas of an image to have darker less visually noticeable Black levels, which can be noticeable with darker image content on LCDs. Also see the Viewing Tests section below for additional details.
With Local Dimming, complex algorithms are needed to make a complex set of compromises between image brightness and Black levels across the screen, and all 180 zones have to be adjusted real-time frame-to-frame with the changing video content. When a particular zone is darkened it produces lower Black levels but the zone can no longer produce bright pixel content anywhere within the zone, so its peak brightness is reduced by the same amount that the Black level is lowered with dimming. A factor of 2 improvement in the Black level means that the peak brightness is reduced by the same factor of 2 everywhere in the zone — a tradeoff that diminishes some bright picture content in return for a darker black. Another crucial issue is that adjacent and nearby zones must all have similar coordinated dimming levels so that visible differences between adjacent zones that can give rise to visually noticeable quilting, halos, and blooming effects, are not visually apparent. This means that many areas in an image cannot be sufficiently darkened when the picture content in nearby zones is brighter.
Screen shots demonstrating Local Dimming:
Below are photographic screen shots of both TVs to demonstrate these Black level and Local Dimming issues. Both photos were taken of images made with just single pixel width horizontal and vertical lines — the first is along all the outside edges of the screen, and the second just has a single horizontal line across the center of the screen. The photos were taken in the dark, with no light falling on the screens, but with the area behind the TVs dimly backlit for visual reference. A few tiny lights in the lab below the TVs are also seen. The LG OLED TV remains perfectly black except for the single pixel width lines. The Samsung LCD TV shows large scale areas of the screen with a visible grey background glow due to the Local Dimming management issues mentioned above. The photos demonstrate the compromises and limitations of Full Array Local Dimming.
Colour Gamuts
Both TVs have a native Colour Gamut based on the larger DCI-P3 Gamut proposed for UHD TVs. Although the UHD Alliance standard has not been finalised, UHD TVs will need 90 per cent or more of the DCI-P3 Gamut. We measured 93 per cent of DCI-P3 for the LG OLED TV and 104 per cent of DCI-P3 for the Samsung LCD TV, which are shown in Figure 1 along with other TV Picture Modes. So both TVs meet the proposed UHD standard. The Samsung LCD is able to exceed the DCI-P3 Colour Gamut by using Quantum Dots, which are explained in detail in this earlier article.
Since over 99 per cent of all currently available consumer content is based on Full HD, which uses the sRGB / Rec.709 Colour Gamut, both TVs also need to support this Standard Gamut, which is called the Cinema mode for the LG OLED TV and the Movie mode for the Samsung LCD TV. It is implemented using Colour Management of the larger native DCI Colour Gamut. We measured 106 per cent of the sRGB / Rec.709 Standard for both TVs, which are shown in Figure 1 along with other Picture Modes. They are both a very good match to the sRGB / Rec.709 Standard, with the 6 per cent excess primarily resulting from a slightly over saturated Blue Primary, which isn’t as important as accurate Red and Green primaries as explained in thisarticle. See the Colours and Intensities section and Figure 1 for measurements and details. The Colour Gamuts also vary significantly with Viewing Angle, see below.
Another very important point that is widely misunderstood is that the TV should actually be set to match the Colour Gamut that was used in producing the original picture content that is being shown, and not a larger Colour Gamut because that makes the colours worse, not better. A UHD TV can not increase the Colour Gamut of any earlier non-UHD picture content. Using the larger UHD DCI Colour Gamut for Full HD content can not show additional colours that are not present in the original content — so it will just exaggerate and distort the true image colours.
Absolute Colour Accuracy
Colour accuracy is particularly important for TVs, and their accuracy has been steadily improving as the result of many more manufacturers using fully automated colour calibration with instruments at the factory instead of having assembly workers visually tweaking the colours.
We measured the Absolute Colour Accuracy of both TVs for the sRGB / Rec.709 Colour Gamut, which accounts for over 99 per cent of all current consumer content. In the future we’ll measure it for the UHD DCI Colour Gamut once the Standard is finalised and a reasonable amount of consumer content becomes available.
Both TVs have very good colour accuracy — both are tied with an impressive Average Colour Error of 1.8 JNCD, which is typically visually indistinguishable from perfect (but their Maximum Colour Errors are larger) — the most colour accurate TVs that we have ever measured. See this Figure for an explanation and visual definition of JNCD and the detailed Colour Accuracy Plots showing the measured Colour Errors for both TVs. See the Colours and Intensitiessection and this Figure for measurements and details. Note that these measurements are only for 0 degrees Viewing Angle — the Colour Accuracy also varies with Viewing Angle in the same way as the Colour Gamut, see below.
Grey Scales and Image Contrast
The Intensity Scale (sometimes called the Grey Scale) generally gets less attention, but it is extremely important because it not only controls the contrast within all displayed images but it also controls how the Red, Green and Blue primary colours mix to produce all of the on-screen colours. So if the Intensity Scale doesn’t closely follow the Standard that was used in producing the content then the colours and intensities will be wrong everywhere in all images.
The steeper the Intensity Scale the greater the image contrast and the higher the saturation of displayed colour mixtures. The Intensity Scale is logarithmic and its steepness is called the display’s Gamma. The Gamma for the LG OLED TV Intensity Scale is 2.16, which is fairly close to the Standard Gamma of 2.20. The Gamma for the Samsung TV is 2.07, which is noticeably lower than the Standard (and with a large 21 per cent Luminance bump at 35 per cent signal intensity). Figure 3 shows the measured Intensity Scales for the TVs alongside the industry standard Gamma of 2.2. See the Colours and Intensities section and Figure 3 for measurements and details. The Intensity Scales and Gamma also vary significantly with Viewing Angle, see below.
Changes with Viewing Position and Angle
Large screen TVs are often watched by multiple viewers from a wide range of viewing positions and angles. So far we have examined how the TV displays perform from the ideal central Sweet Spot with a 0 degrees Viewing Angle. We now consider how each of the TV display performance and picture quality metrics examined above change (degrade) with Viewing Angle. All displays and display technologies show some variation for each metric with angle. The smaller the change with Viewing Angle the better. We repeated the tests and measurements at a 45 degree Viewing Angle, which is typical for TVs, and also at 60 degrees to see what happens at larger angles.
As shown in detail below, the LG OLED TV shows relatively small changes with Viewing Angle for all of the display metrics, as we had expected. On the other hand, the Samsung LCD TV shows rather large changes with Viewing Angle for all of the display metrics, which was unexpected and surprising for a high-end TV. The source of the problem is that Samsung is using an LCD panel with PVA LCD technology instead of IPS, FFS, or PLS LCD technology, which many consumers know are found in the best and highest performing LCD smartphones, tablets, and monitors because of their excellent wide viewing angle performance with small colour and contrast changes with angle. In addition, using a larger DCI Colour Gamut together with a PVA LCD magnifies the colour changes and shifts with angle.
Measurements with Viewing Angle
The changes with Viewing Angle are quite large and very important so we covering them in detail below. We cover each of the display metrics in turn, and then include some screen shot photos of the TVs to show these effects visually. The links below are for the Figures that clearly show how each of the metrics varies with Viewing Angle. All of the display performance metrics that we measured and discussed above can change significantly, even drastically with Viewing Angle and position. We examine each one in turn:
Colour Changes and Shifts with Viewing Angle: One of the biggest challenges for TV picture quality is minimising any noticeable changes or shifts in the image colours with Viewing Angle — both the hue and saturation. Pure White and the fully saturated native pure Red, Green and Blue Primary Colours for each display change the least with Viewing Angle — it is actually the large range of colours that lie in the middle in between the outer fully saturated native Primaries and the inner central White point that change the most with Viewing Angle, and that is where most TV picture content exists.
To evaluate the Colour Changes with Viewing Angle we measured the shift in the Primary Colours for the sRGB / Rec.709 Colour Gamut, which accounts for over 99 per cent of the current consumer content. This shows how the internal sRGB / Rec.709 Primary Colours change, but these same effects apply to most picture colours and content as explained above. For the LG OLED TV the entire Colour Gamut changes only slightly, increasing by 7 and 9 per cent at 45 and 60 degrees. For the Samsung LCD TV the entire Colour Gamut changes drastically, decreasing by 42 and 59 per cent at 45 and 60 degrees, producing very noticeable colour shifts and loss of colour saturation with Viewing Angle. This Figure shows how the colours shift from 0 degrees to 45 and 60 degrees. Screen shots are shown below.
Brightness Decreases with Viewing Angle: For almost all displays the picture brightness will decrease with increasing in Viewing Angle. As long as it isn’t too large it’s not really objectionable because it doesn’t distort or reduce the picture quality, it just dims the picture. For the LG OLED TV the maximum brightness (Luminance) decreases by just 19 per cent at 45 degrees, but the Samsung LCD TV has a large 52 per cent decrease, which is quite noticeable and significant. This Figure shows how the Brightness decreases in 5 degree increments up to 60 degrees.
Black Level Increases with Viewing Angle: There is no change in the Black Level with Viewing Angle for the LG OLED TV (0 per cent increase), but there is a very large increase in the Brightness of the Black Level for the Samsung LCD TV, an increase of 419 per cent at 45 degrees, often resulting in a noticeable background haze across the image even at moderate Viewing Angles. This increase does not depend or change with LCD Local Dimming. This Figure shows how the Black Level increases in 5 degree increments up to 60 degrees.
Intensity Scale Changes with Viewing Angle: There is essentially no change in the Intensity Scale for the LG OLED TV with Viewing Angle but a very large change for the Samsung LCD TV, which is shown in this Figure. The Intensity Scale variation with angle is the root cause of all the other changes with angle.
Screen Shot Photos with Viewing Angle
The photos below are screen shots of both TVs at 0 degrees and 45 degrees Viewing Angles for visually comparing the changes with Viewing Angle. For the 45 degrees side viewing angle, the keystone geometric distortion that is normally seen from that position has been removed to make the comparison with 0 degrees more straight forward. Note that the best way to visually evaluate changes with Viewing Angle is to look at a fixed image while you shift your viewing position. The photos below are of a Red Barn Door from the DisplayMate Multimedia with Test Photos Edition.
The LG OLED TV shows only a slight colour change between the 0 and 45 degrees Viewing Angle positions. On the other hand, the Samsung LCD TV shows relatively large changes in hue, saturation, and image contrast between the 0 and 45 degrees Viewing Angle positions for the reasons explained above. The camera exposures were adjusted to equalise the photo brightness levels, so the differences in display brightness are not shown. Note that all of the white knobs have roughly the same appearance and brightness. The Samsung LCD TV shows a more saturated orange colour at 0 degrees as the result of the somewhat different colour calibrations and Intensity Scales for the two TVs (see Figure 2 and Figure 3). The point being demonstrated here is the colour change with Viewing Angle and not the difference in the colour calibration between the two TVs.
Response Time and Motion Blur
Motion Blur is a well known issue with LCDs that is seen with rapidly moving objects in the picture, and also when the camera itself moves, which shifts the entire screen image all at once. It arises because the Liquid Crystal, which is the active element within an LCD, is unable to change its orientation and light transmission rapidly enough when the picture changes from one frame or refresh cycle to the next. OLEDs, as solid state emissive devices, have very fast Response Times: LG specifies the OLED Response Time at 0.1ms, which is more than a factor of 10 faster than LCDs.
For the Response Time and Motion Blur tests we photographed a DisplayMate Multimedia with Motion Edition Test Pattern moving at a moderately fast Full HD 1,272 pixels per second using a Nikon DSLR camera with a shutter speed of 1/320th of a second, which is faster than the Refresh Rate and motion compensation rate for the TVs. At 1,272 pixels per second it takes 1.2 seconds to move diagonally across the entire screen.
The LG OLED TV screen shot below shows a single crisp image, without any visible latent blur or ghost images left over from earlier refresh cycles or any shading in the image (see below). This indicates a Response Time that is significantly faster than 5ms.
For the Samsung LCD TV screen shot it is possible to make out a total of 4 images of the moving diamond-box (the current and 3 earlier images) on the grey background at the 120 Hz refresh rate, indicating a Response Time in the neighbourhood of 20 ms for this LCD.
The darker grey shading gradient to the bottom and right sides of the Samsung LCD TV screen shot photograph is due to the limited response time of the LCD to the grey block moving on the black screen background. Grey response times are typically longer.
Response Time and Motion Blur Screen Shots
|
|
|
LG OLED TV |
Samsung LCD TV |
TV Display Power Efficiency
Display power efficiency is extremely important for mobile displays, but it is also very important for TVs for several reasons: one is that there are roughly 330 million TVs in the US that are on over 600 billion hours per year, accounting for almost 10 per cent of the total US residential power consumption.
Display power efficiency is also very important because the power gets transformed into heat, which affects the performance of the display. For example, in the lab tests it took the Samsung LCD almost 2 hours to reach a stable operating point (and internal temperature), something that consumers are not likely to notice, but which clearly affects the display’s performance (and delayed the measurements while we waited for it to stabilise).
Display power efficiency is especially important for OLEDs because the power has to be distributed directly to every individual sub-pixel on the screen via the backplane (while for LCDs the backlight power is completely separate from the display panel). So for OLEDs, improving their light emission power efficiency is the primary method needed to increase the peak image brightness, which is critical.
For both TVs the display power used depends on the picture content. OLEDs are light emissive so the brighter the content the more power they use (and none for black). For standard LCDs the display power is independent of content (same for all white or all black). However, the Samsung LCD TV has Local Dimming so it uses less power on darker content because of the local dimming of the backlight.
We measured the average display power for various programs of bright and dark picture content. The LG OLED TV used an average of 39 per cent less power than the Samsung LCD TV for the Cinema/Movie modes, and an average of 17 per cent less power for the Vivid/Dynamic modes for identical Brightness (Luminance) levels. This is an impressive achievement for OLEDS. See the Display Power section for measurements and details.
Viewing Tests
In addition to the comprehensive set of lab tests and measurements we also watched lots of TV and movie content, with both TVs side-by-side showing identical content all viewed simultaneously for direct comparisons.
Samsung LCD TV
When viewed exactly from the central Sweet Spot with a 0 degrees Viewing Angle, the Samsung LCD TV looked very good, with excellent colour accuracy but with slightly reduced image contrast due to a slightly too shallow Intensity Scale. The Full Array Local Dimming worked well and significantly improved the Black Levels. Local Dimming worked best in solid black areas, like in letterboxing, where the outside borders nicely disappeared. But with mixed dark and light picture content Local Dimming isn’t able to sufficiently reduce the Black Levels in the dark portions of the image sufficiently, so they appeared as muffled dark grey areas. This was particularly noticeable with the LG OLED TV right next to it with perfect blacks that showed what the dark picture should actually look like.
However, even a small change in viewing position resulted in large noticeable changes and degradation in the picture quality. The Black Levels increased tremendously with Viewing Angle (by a factor of 5.2 at 45 degrees in the measurements) resulting in a quite noticeable background haze across the image, which not only washed out the contrast but also washed out the colours in all but the very brightest and most vibrant pictures. This is the result of using a PVA LCD panel instead of IPS, FFS, or PLS LCD panels that have significantly better viewing angle performance.
LG OLED TV
The viewing tests for the LG OLED TV were simply exceptional, with the picture quality visually indistinguishable from perfect, with excellent colour accuracy and image contrast accuracy (from a near perfect Intensity Scale) together with perfect Black Levels. The very challenging set of DisplayMate Test and Calibration Photos that we use to evaluate picture quality looked absolutely stunning and Beautiful, even to my experienced hyper-critical eyes.
Even with large changes in viewing position and viewing angle, the picture quality remained excellent with no visible changes in the near perfect image contrast and no changes in the perfect Blacks Levels, and just slight changes in brightness and relatively small changes in colour with angle. So everyone watching the TV sees an excellent picture regardless of their viewing location.
OLED and LCD TV Conclusions:
Testing both of these flagship high-end top-of-the-line OLED and LCD TVs side-by-side at the same time using simultaneous identical test patterns and picture content was incredibly interesting, and also incredibly revealing because they were side-by-side for all of the tests and comparisons.
Some of the test results and conclusions summarized below are not that unexpected. OLED TVs have all of the same high performance picture quality advantages as Plasma TVs, which were overwhelmingly preferred by videophiles over traditional LCDs — and OLEDs now significantly outperform the Plasmas across the board in all categories — so the performance advantages are even greater for OLEDs. However, the latest high-end LCDs also outperform traditional LCDs…
Below we list separately the OLED TV and LCD TV Conclusions together with their respective strengths, weaknesses, and future improvements. See the main Display Shoot-Out Comparison Table for all of the DisplayMate Lab measurements and test details, and see the Results Highlights section above for detailed explanations of the Conclusions presented below.
OLED TV Conclusions
The LG Flagship OLED TV performed extremely well throughout all of the lab tests and viewing tests. It is unquestionably the best performing TV that we have ever tested or watched… with absolutely stunning and beautiful picture quality across the board. In terms of picture quality the LG OLED TV is visually indistinguishable from perfect. Even in terms of the exacting and precise lab measurements it is close to ideal.
The LG OLED TV is far better than the best Plasma TVs in every display performance category, and even better than the $US50,000 Sony Professional CRT Studio Monitors that up until recently were the golden standard for picture quality.
The LG OLED TV outperformed the Samsung LCD TV in every category except Brightness (Luminance) for image content with Average Picture Levels (APL) greater than 25 per cent. The under 25 per cent APL range covers all standard TV content, including digital photos, videos and movies, but does not include Smart TV or PC applications, which can have higher APLs from text screens on white backgrounds.
The LG OLED TV performed the best in these categories:
Much lower Screen Reflectance — higher Brightness for both tested picture modes — perfect Black Levels — infinite Contrast Ratio — higher Contrast Rating for High Ambient Light — higher Absolute Colour Accuracy (a tie only at 0 degrees) — more accurate Intensity Scale and Gamma — much better Viewing Angle performance for all tested metrics — very fast Response Time and no Motion Blur — higher display Power Efficiency for TV video content. See the Results Highlights section and Display Shoot-Out Comparison Table for all of the measurements and details.
Improving OLEDs:
It is especially interesting that LG has continued to systematically improve the display performance of their already high performance OLED TVs. In almost every single test and measurement category the tested 2015 OLED TV performs better than the first generation model that we tested in 2013, which already had excellent display performance and we rated it the best TV tested up to that time. Those continuing improvements are what lead to top display performance, which we hope LG will continue for their next generation OLED TVs.
What should come in the next generation of OLED TVs?
The OLED performance for all of the above display metrics can undoubtedly continue to be improved. In particular, it is a safe bet that the Brightness and Power Efficiency will definitely increase again, and we’ll also see improvements in the Colour Gamut, Colour Accuracy, and Viewing Angle performance.
From a consumer perspective:
The most important consumer issue for LG will be bringing down the price of their OLED TVs as quickly as possible. The retail price for this state-of-the-art Flagship OLED TV is $US6,000 US (September 2015), way above what most consumers can afford. But putting this into perspective, early high-end Plasma TVs cost considerably more than $US10,000 (and that’s not counting inflation), so OLED prices will undoubtedly come down soon — in fact, earlier generation 55 inch LG OLED Full HD TVs are now available for $US2,000. Finally, because OLEDs are solid state devices, it is quite possible that their production cost will some day be lower than LCDs.
LCD TV Conclusions
The Samsung LCD TV performed exceptionally well for an LCD display with its state-of-the-art Full Array Local Dimming, Quantum Dots, and a curved screen, but that applies only when it is being viewed straight ahead from directly in front of the center of the screen, which is called the Sweet Spot. From other viewing positions and viewing angles the display performance and picture quality decrease noticeably.
The Samsung LCD TV performed the best in only one category:
Higher Brightness for Average Picture Levels greater than 25 per cent. This higher APL range covers Smart TV and PC applications, which often have higher APLs due to the use of white backgrounds for text. In two other test categories it came close to the LG OLED TV in Brightness for APLs under 25 per cent, and in Absolute Colour Accuracy, but only for 0 degrees Viewing Angle. See the Results Highlights section and Display Shoot-Out Comparison Table for all of the measurements and details.
LCD’s inherent strengths:
LCDs like all display technologies have their own particular inherent strengths and weaknesses. LCD’s strengths include being able to produce very high image brightness by using powerful backlights, very wide Colour Gamuts by using Quantum Dots, very large size screens, and at much lower cost compared to other competing technologies. As a result, LCDs now have over 90 per cent market share, so the majority of consumers are satisfied with LCD performance and picture quality.
LCD’s competition and responses:
While LCDs have by far the highest current market share, competing technologies from CRT, to Plasma, and now OLED have in turn played to some of the LCD’s weaknesses by producing very high performance displays with very low Black levels, very high Contrast Ratios, very wide viewing angles without colour, contrast, or black shifts, and very fast response times without Motion Blur. In turn, high-end LCDs like those on the Samsung TV have responded by adding Full Array Local Dimming to improve the Black levels, Quantum Dots to increase the Colour Gamut, and advanced signal processing to improve the Response Time and reduce Motion Blur. While high-end LCD performance has been significantly improved in these areas, OLEDs still deliver higher performance as our extensive tests have shown.
Large changes with viewing position and angle:
The Samsung LCD TV shows rather large changes in picture quality with Viewing Angle for all of the performance metrics — Colour, Brightness, Black Level, and Image Contrast listed here — which is surprising for a high-end large screen TV because they are frequently watched by multiple viewers from a wide range of viewing angles. The source of the problem is that Samsung is using an LCD panel with PVA LCD technology instead of IPS, FFS, or PLS LCD technology, which many consumers know are found in the best and highest performing LCD smartphones, tablets, and monitors because of their excellent wide viewing angle performance with small colour and contrast shifts with angle.
Combining PVA with Quantum Dots:
A major strategic technical flaw in the Samsung TV was combining PVA LCD technology together with a native wide DCI Colour Gamut, when over 99 per cent of all current consumer TV, video, digital photo, computer, and web image content uses the smaller Full HD sRGB / Rec.709 Standard Colour Gamut. The fundamental problem is that PVA LCDs have much larger performance variations with viewing angle than IPS, FFS, PLS LCDs, and as a result the colour variations with viewing angle are considerably magnified when implementing the smaller Full HD Colour Gamut from the larger native DCI Gamut as shown in this figure and explained in detail here.
What should come in the next generation of LCD TVs?
LCDs are a great display technology with lots of inherent native strengths that manufacturers should concentrate on and exploit instead of trying to pursue OLEDs on their native strengths. So LCD manufacturers should exploit very high image brightness, very large screens, very wide colour Gamuts with Quantum Dots to improve picture quality in high ambient light. For wide Colour Gamut displays and TVs using Quantum Dots it is essential they use IPS, FFS, PLS or equivalent LCD technologies with excellent Viewing Angle performance to eliminate the large colour shifts with angle that are produced by PVA (and other) LCD technologies. Finally, stick with flat screens — curved screens are especially challenging to implement for LCDs — leave those to OLEDs.
Display Shoot-Out Comparison Table
Below we examine in-depth the LG OLED TV (Model 65EG9600) and the Samsung LCD TV (Model UN65JS9500) based on objective Lab measurement data and criteria. For additional background information see our 2013 LG OLED TV Display Technology Shoot-Out. For comparisons with the other TVs and Multimedia displays see our Display Technology Shoot-Out series.
Many of the measurements were made with a Konica Minolta CS-2000 Spectroradiometer. The measurements are listed under these section headings: Screen Reflections, Brightness and Contrast, Colours and Intensities, Viewing Angles, OLED and LCD Spectra, Display Power.
Click this link to see the complete Data Comparison Table.
Republished with the permission of DisplayMate Technologies.