OpenStreetMap, the free wiki world map, is a wonderful little project that has become hugely successful. Now, the team behind it has released a report that explains how it’s changed over the last eight years — and some of the results are damn pretty.
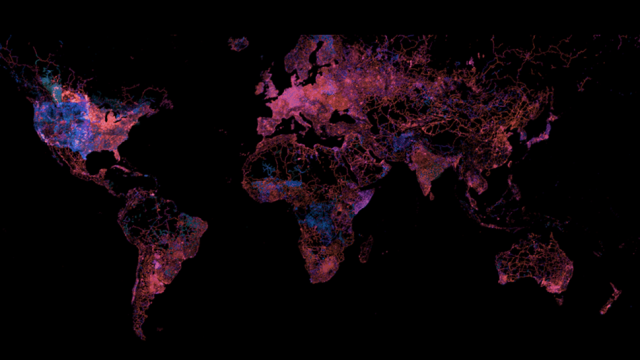
The database now contains over 33 million kilometres of road data and 78 million buildings. When you think that all that data has been committed to the database voluntarily, it’s kind of staggering. But the best bit of the report has to be this map of edits over the last eight years.
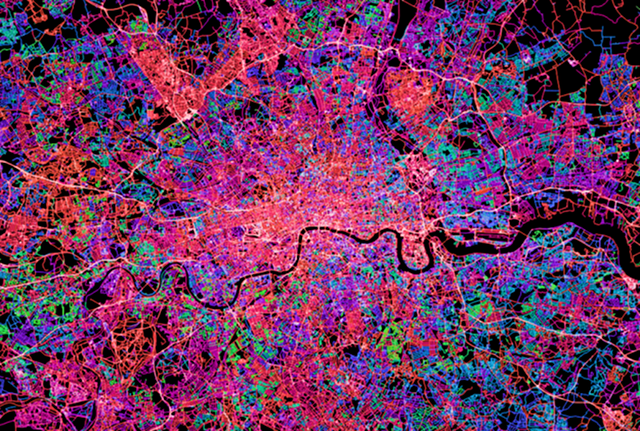
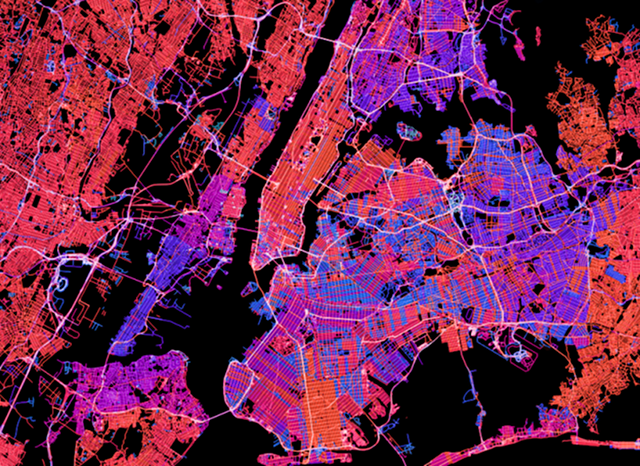
The colour scale ranges from green for old, through blue then pink, to white for recent. At the worldwide level it looks pretty; zoom in and it’s fascinating. Below are maps of New York and London, but you can check out the whole map here.
[OpenStreetMap via Flowing Data]