The European Space Agency’s Gaia observatory has just unleashed a “treasure trove” of data on nearly 2 billion stars in the Milky Way, revealing how fast they move toward or away from us, as well as unusual ‘starquakes’ that change the shapes of stars.
Gaia’s third release of data arrived Monday, complete with incredible visualisations of our galactic neighbourhood. The space observatory launched in 2013 with a unique quest to deliver the most accurate 3D map of the Milky Way galaxy, with the goal of helping astronomers understand how our galaxy has evolved over time and where we fit in the vast cosmos. Gaia’s first release revealed the position and brightness data for 1.1 billion stars, and this most recent catalogue bumps up that number by quite a bit. The new dataset also includes the largest number of binary stars, as well as galaxies outside the Milky Way and thousands of objects within our own solar system.
The ebb and flow of the Milky Way disc
The Gaia spacecraft has two telescopes on board, and it observes the Milky Way galaxy from an orbital perch called the Lagrange 2, or L2, point, located about 1 million miles (1.5 million kilometers) away from Earth (that’s the same orbit currently being used by NASA’s Webb Space Telescope).
The above visualisation shows the Milky Way’s disc, which stretches about 10,000 light-years across. The rotation of the disc is illustrated through different colours, with darker shades indicating objects moving toward us and brighter shades indicating objects moving away. Meanwhile, there are some outliers that aren’t quite travelling with their surrounding group, which can be spotted as tiny dots in the crowd.
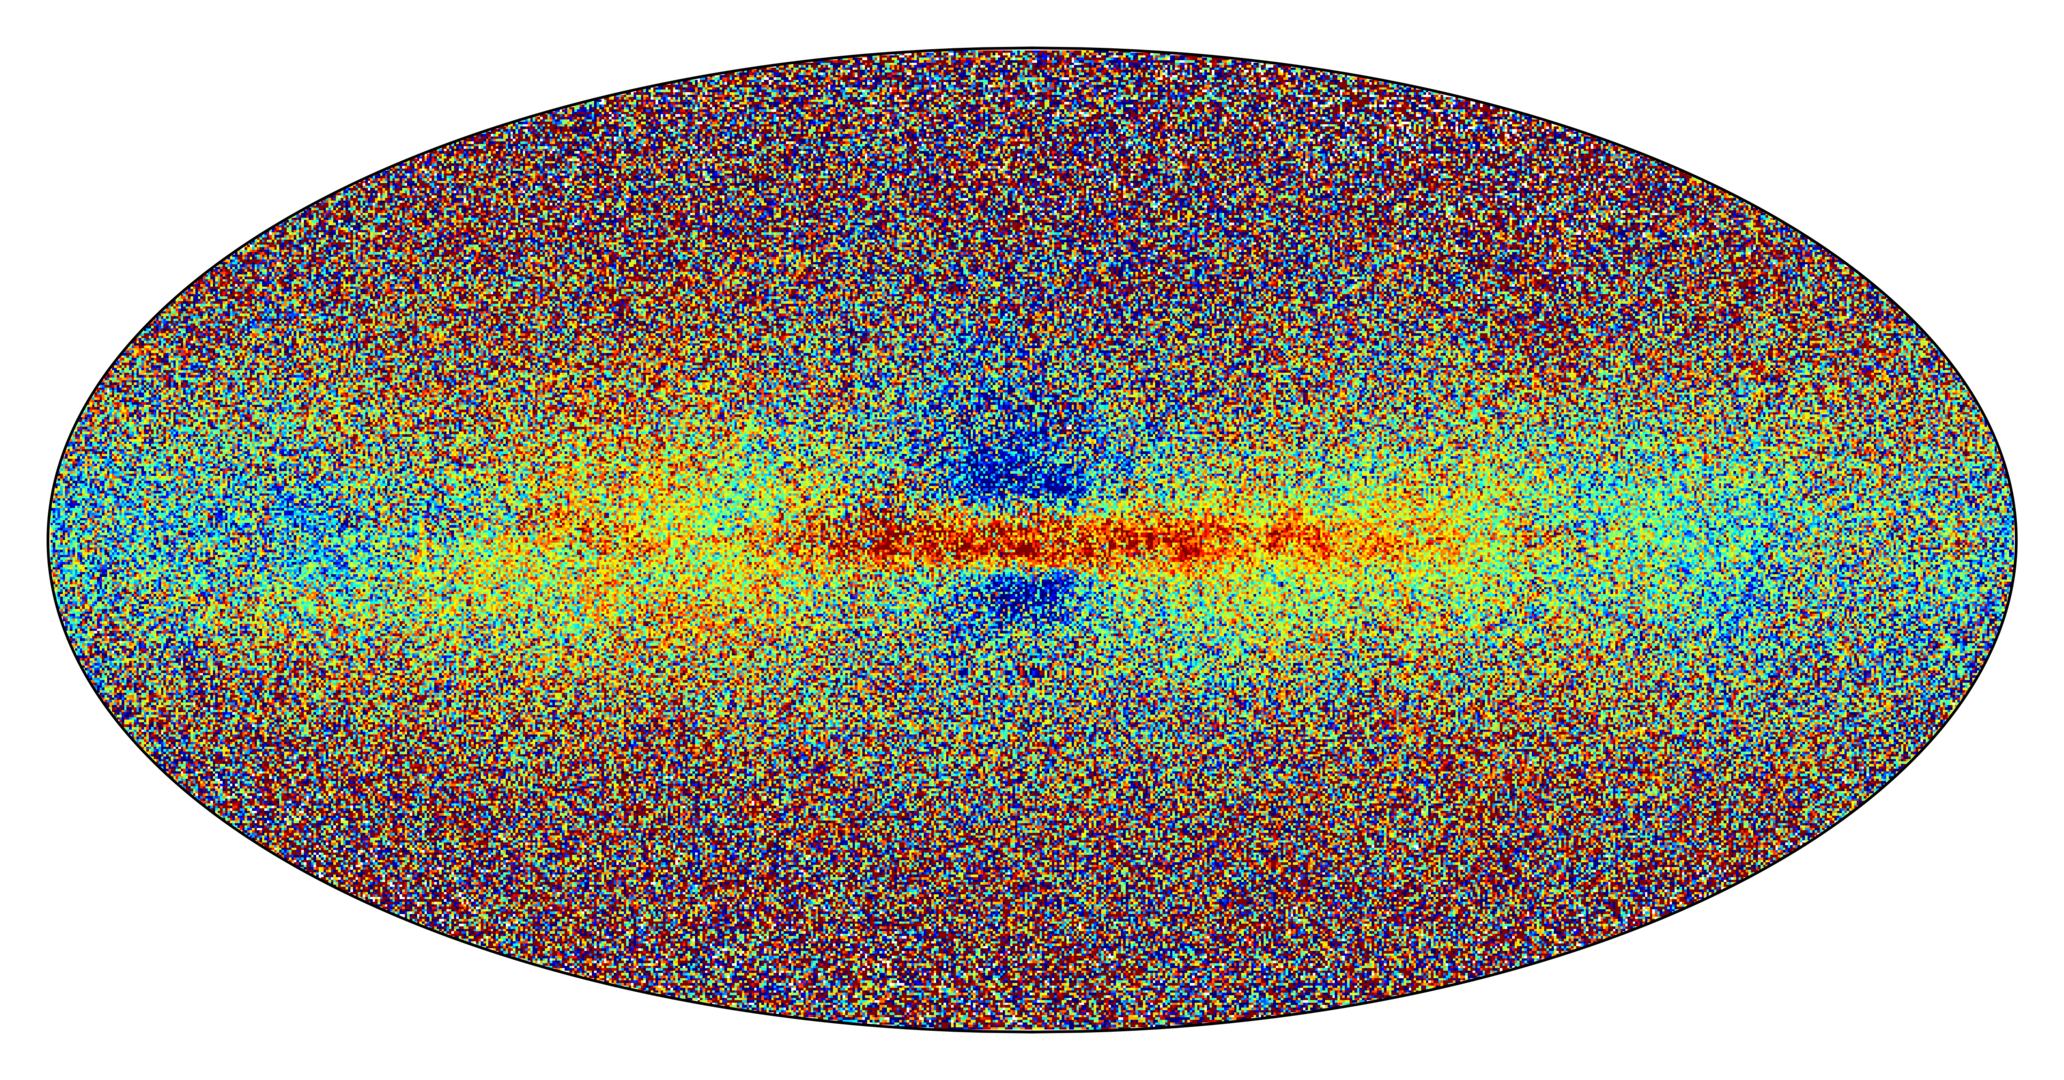
Stellar motion
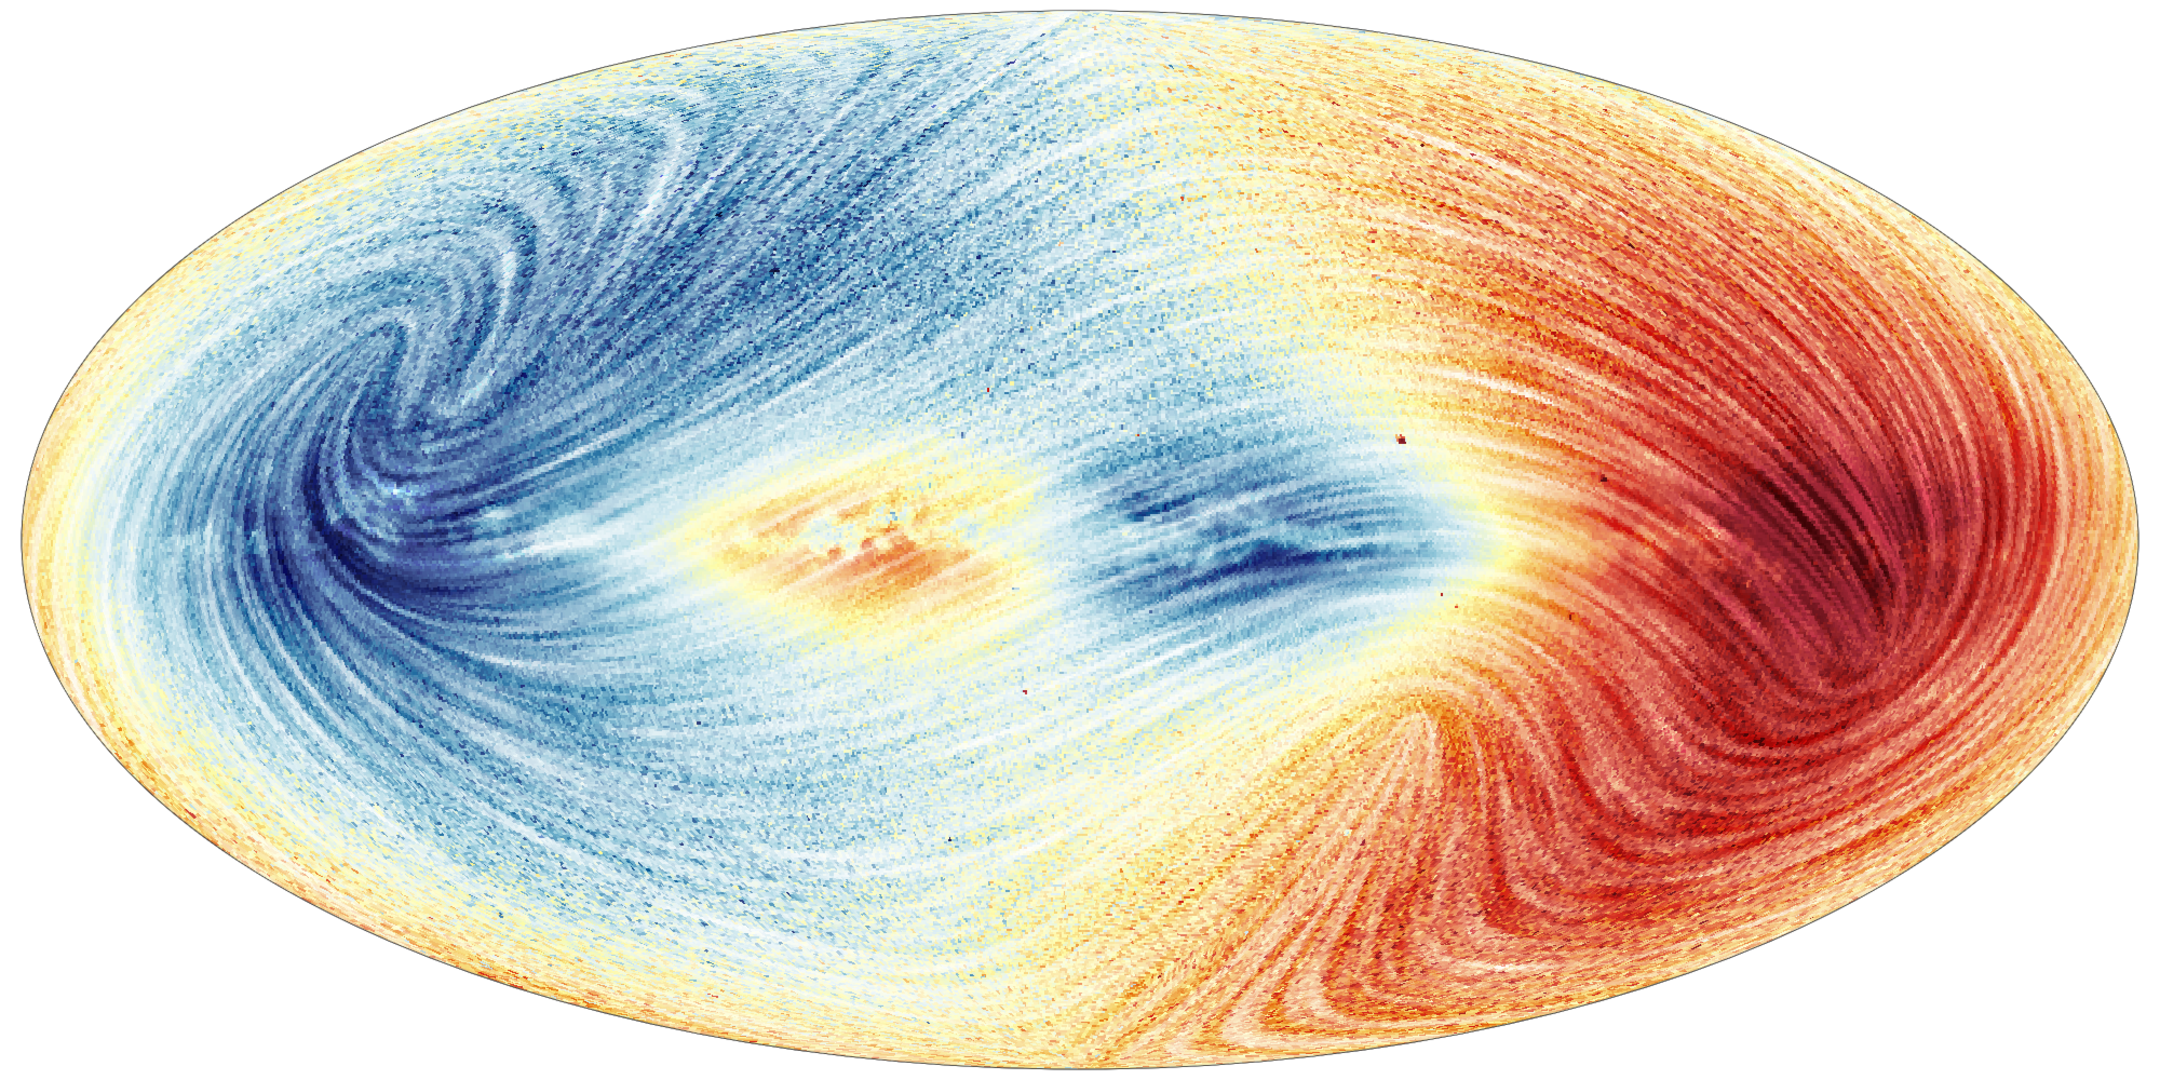
Gazing out at the night sky, you may not be able to tell that stars are constantly in motion, orbiting the centre of the galaxy. The speed at which stars are moving from our perspective on Earth is referred to as radial velocity, or the rate of change in distance between a target and its observer.
This map of the sky reveals the motion of approximately 26 million stars, with different colours indicating the velocities at which the stars are moving. Blue shows the parts of the sky where the average motion of stars is toward us, and red shows the regions where the average motion is away from us. The visualisation reveals the circular motion of the stars around the centre of the Milky Way, appearing as a perfectly combed sandbox of stellar inhabitants.
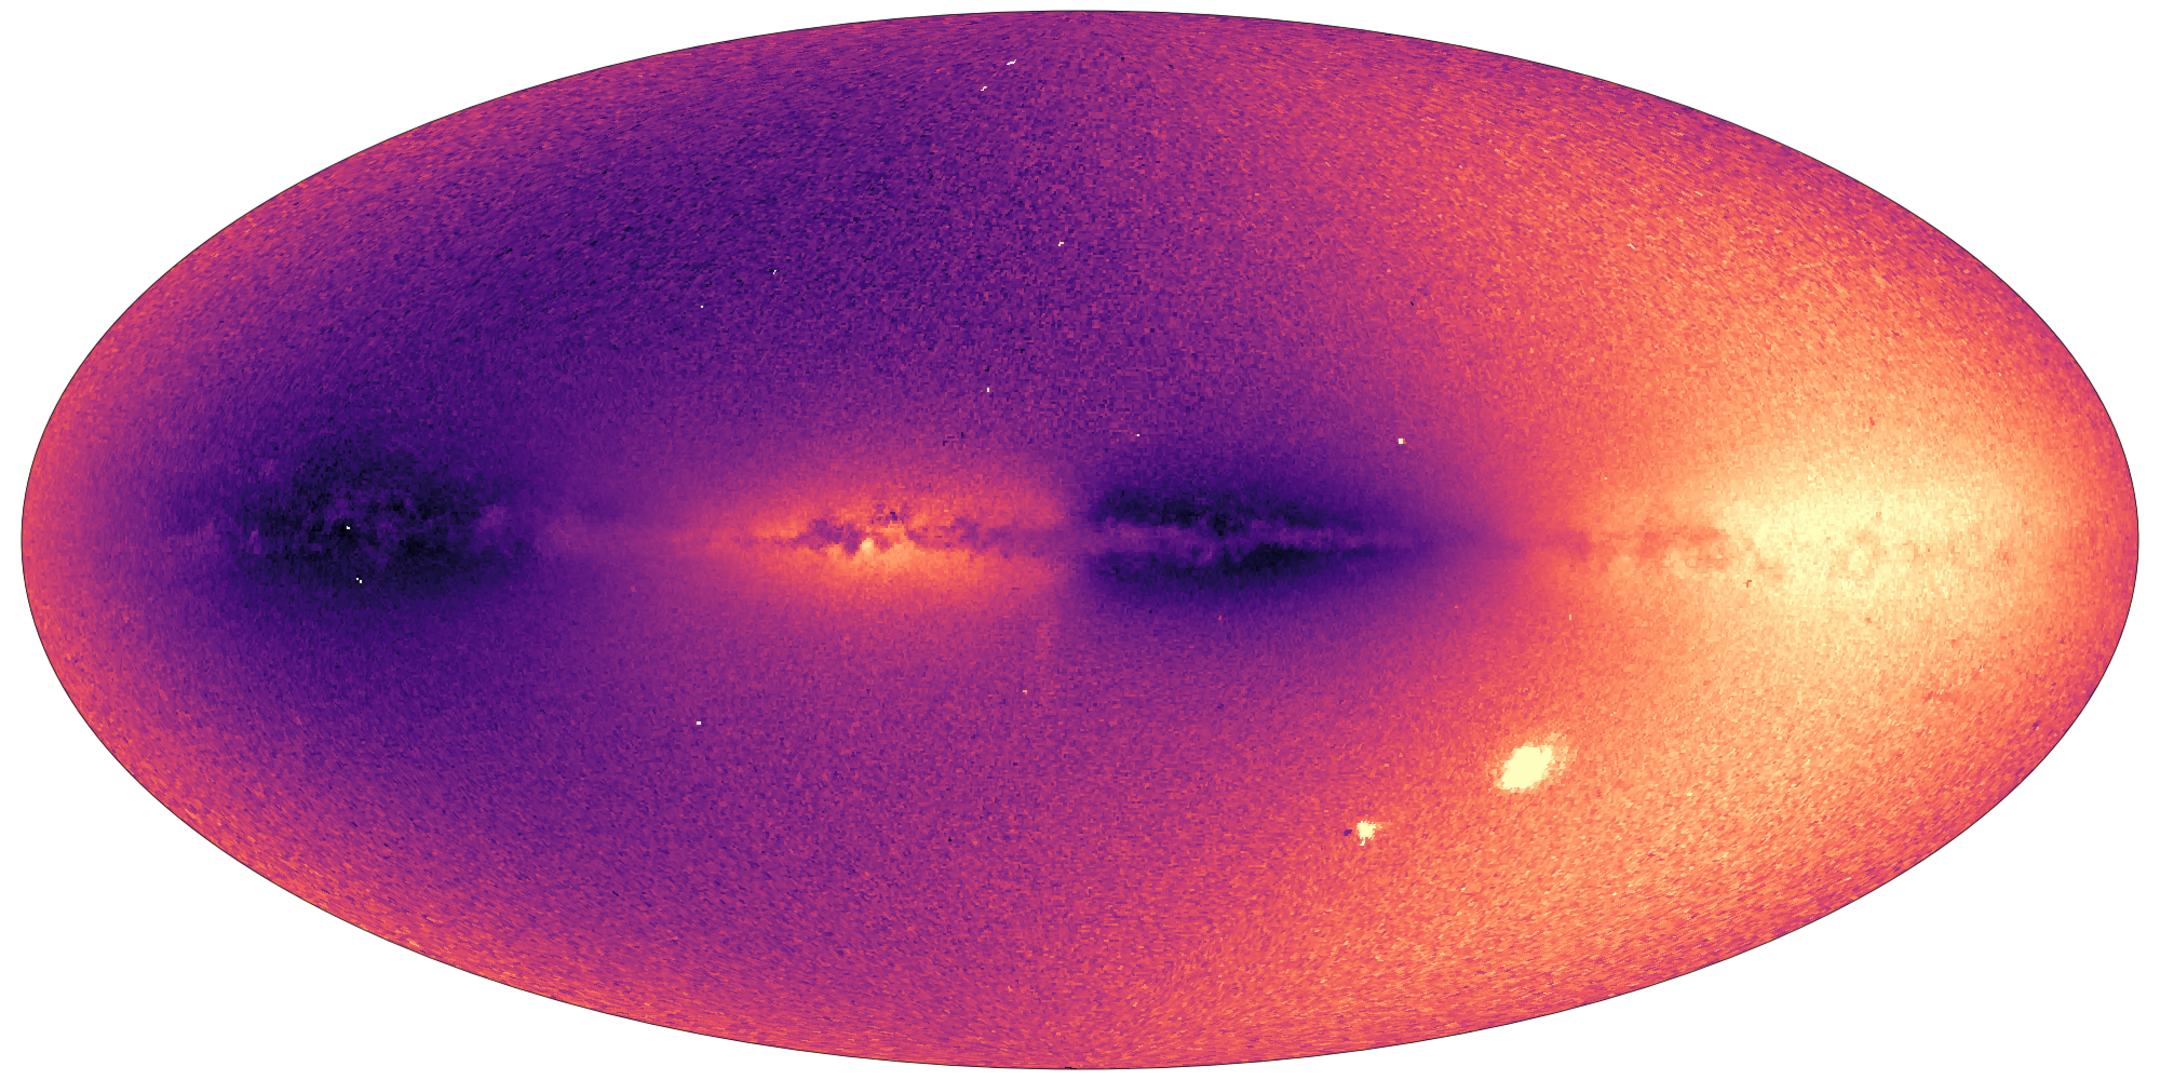
What lies between the stars?
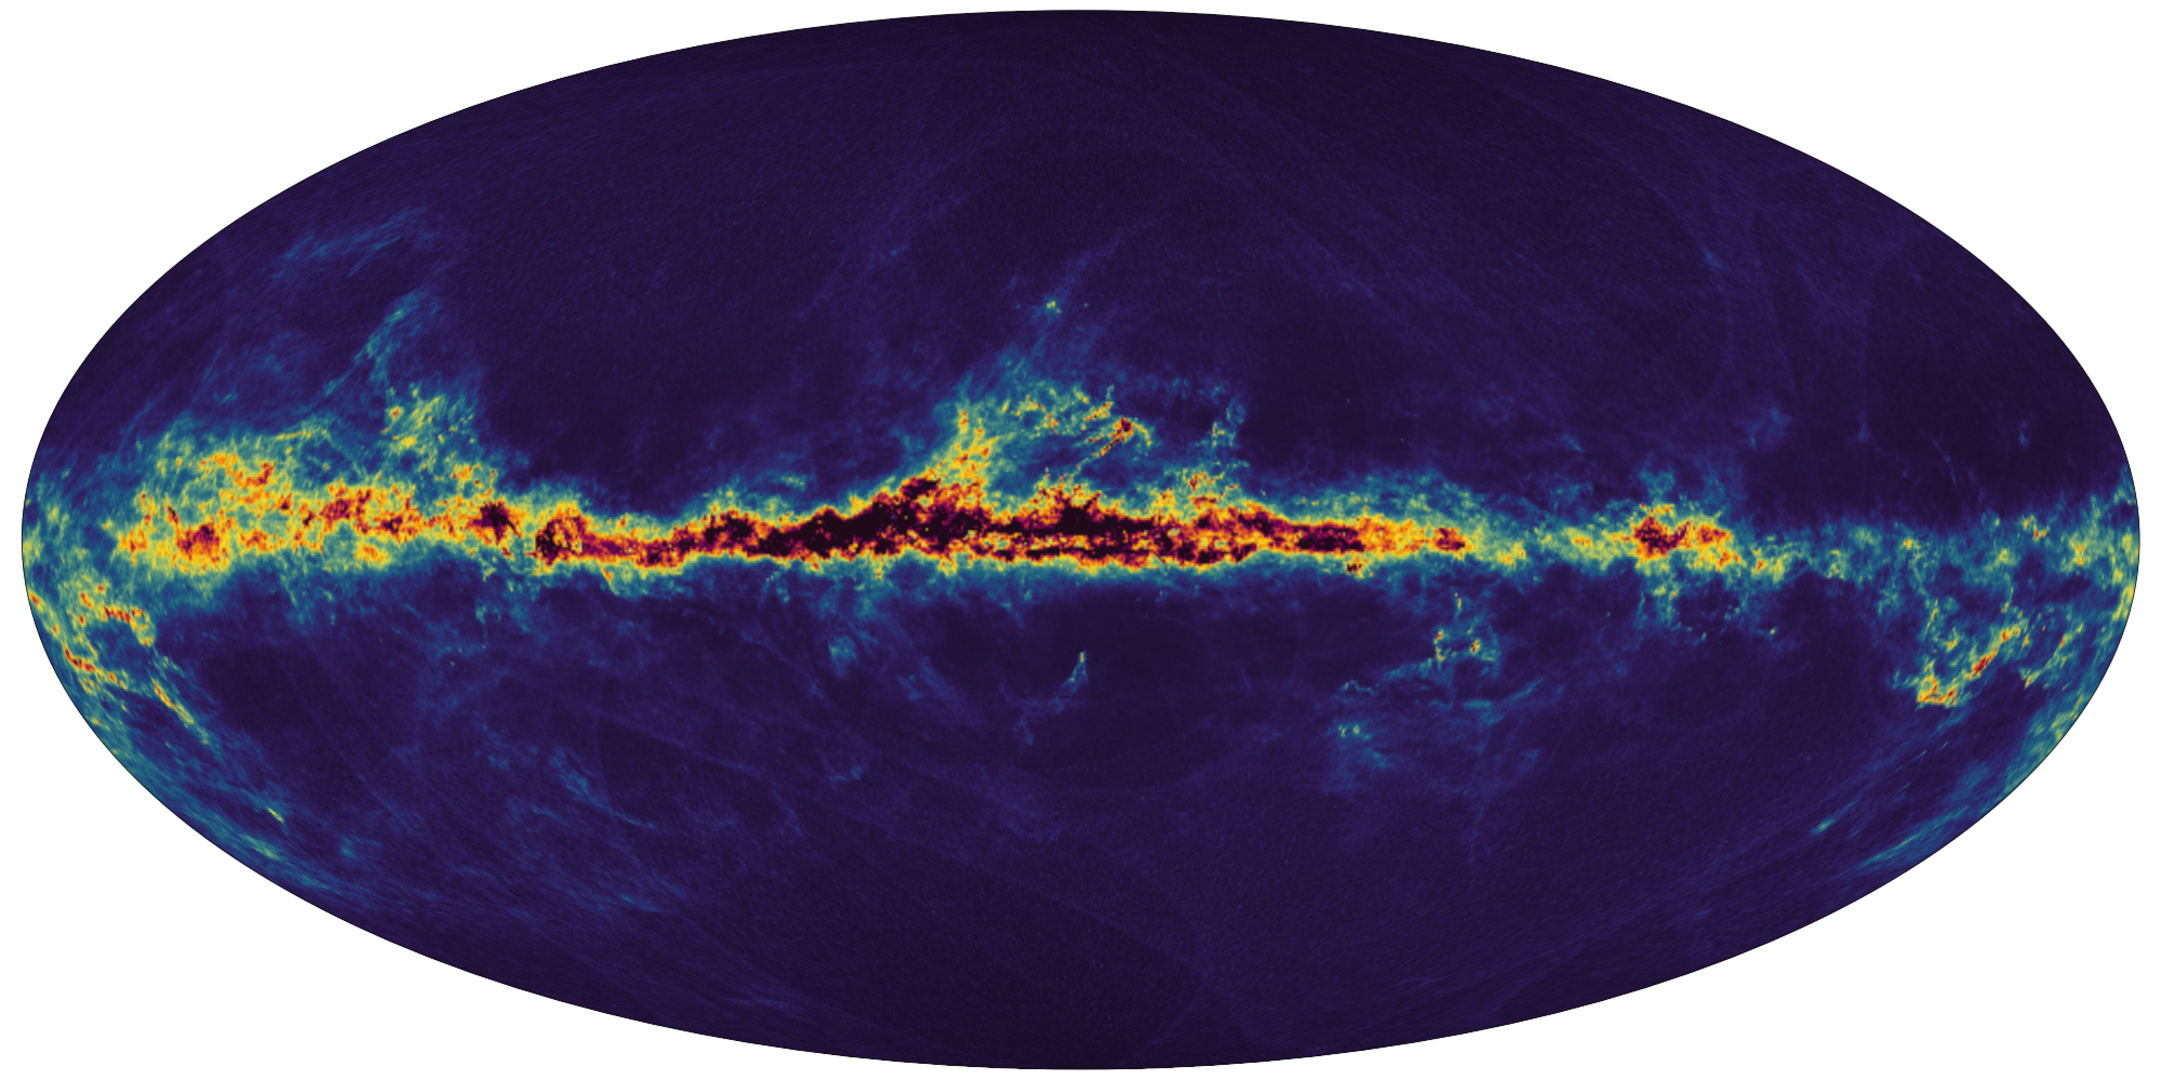
The galactic plane is not all stars. In between those luminous balls of gas are interstellar dust and clouds of gas, from which stars are born.
By measuring the positioning of stars and the light they emit, Gaia also captured the absorption of starlight by the interstellar medium, creating a map of the interstellar dust in the Milky Way. The darker blue areas in the visualisation reveal more concentrated regions of dust, which fades into the yellow to indicate a fading amount of dust.
The chemistry of stars
Stars are formed from clouds of gas and dust, which collapse under huge gravitational forces. The chemical composition of a star tells scientists about where it formed and how it ended up in its current position, thereby painting a better picture of the evolution of the galaxy over time.
Gaia’s data reveals what stars are made of. The reddish stars indicate that they are richer in metals, and therefore created later in the universe’s history. Elements heavier than iron are forged in supernovae, the explosive deaths of large stars.
It’s a starquake
Stars experience their own version of earthquakes, called starquakes. These stellar vibrations are movements of gas, making the stars sort of blink, or change their brightness over a time period that varies from seconds to weeks.
Although Gaia was not originally designed to detect starquakes, the observatory discovered more than 100,000 massive, hot blinking stars. These starquakes allow scientists to peer inside the stars, measuring their temperature, density, and rotation.
Round and round
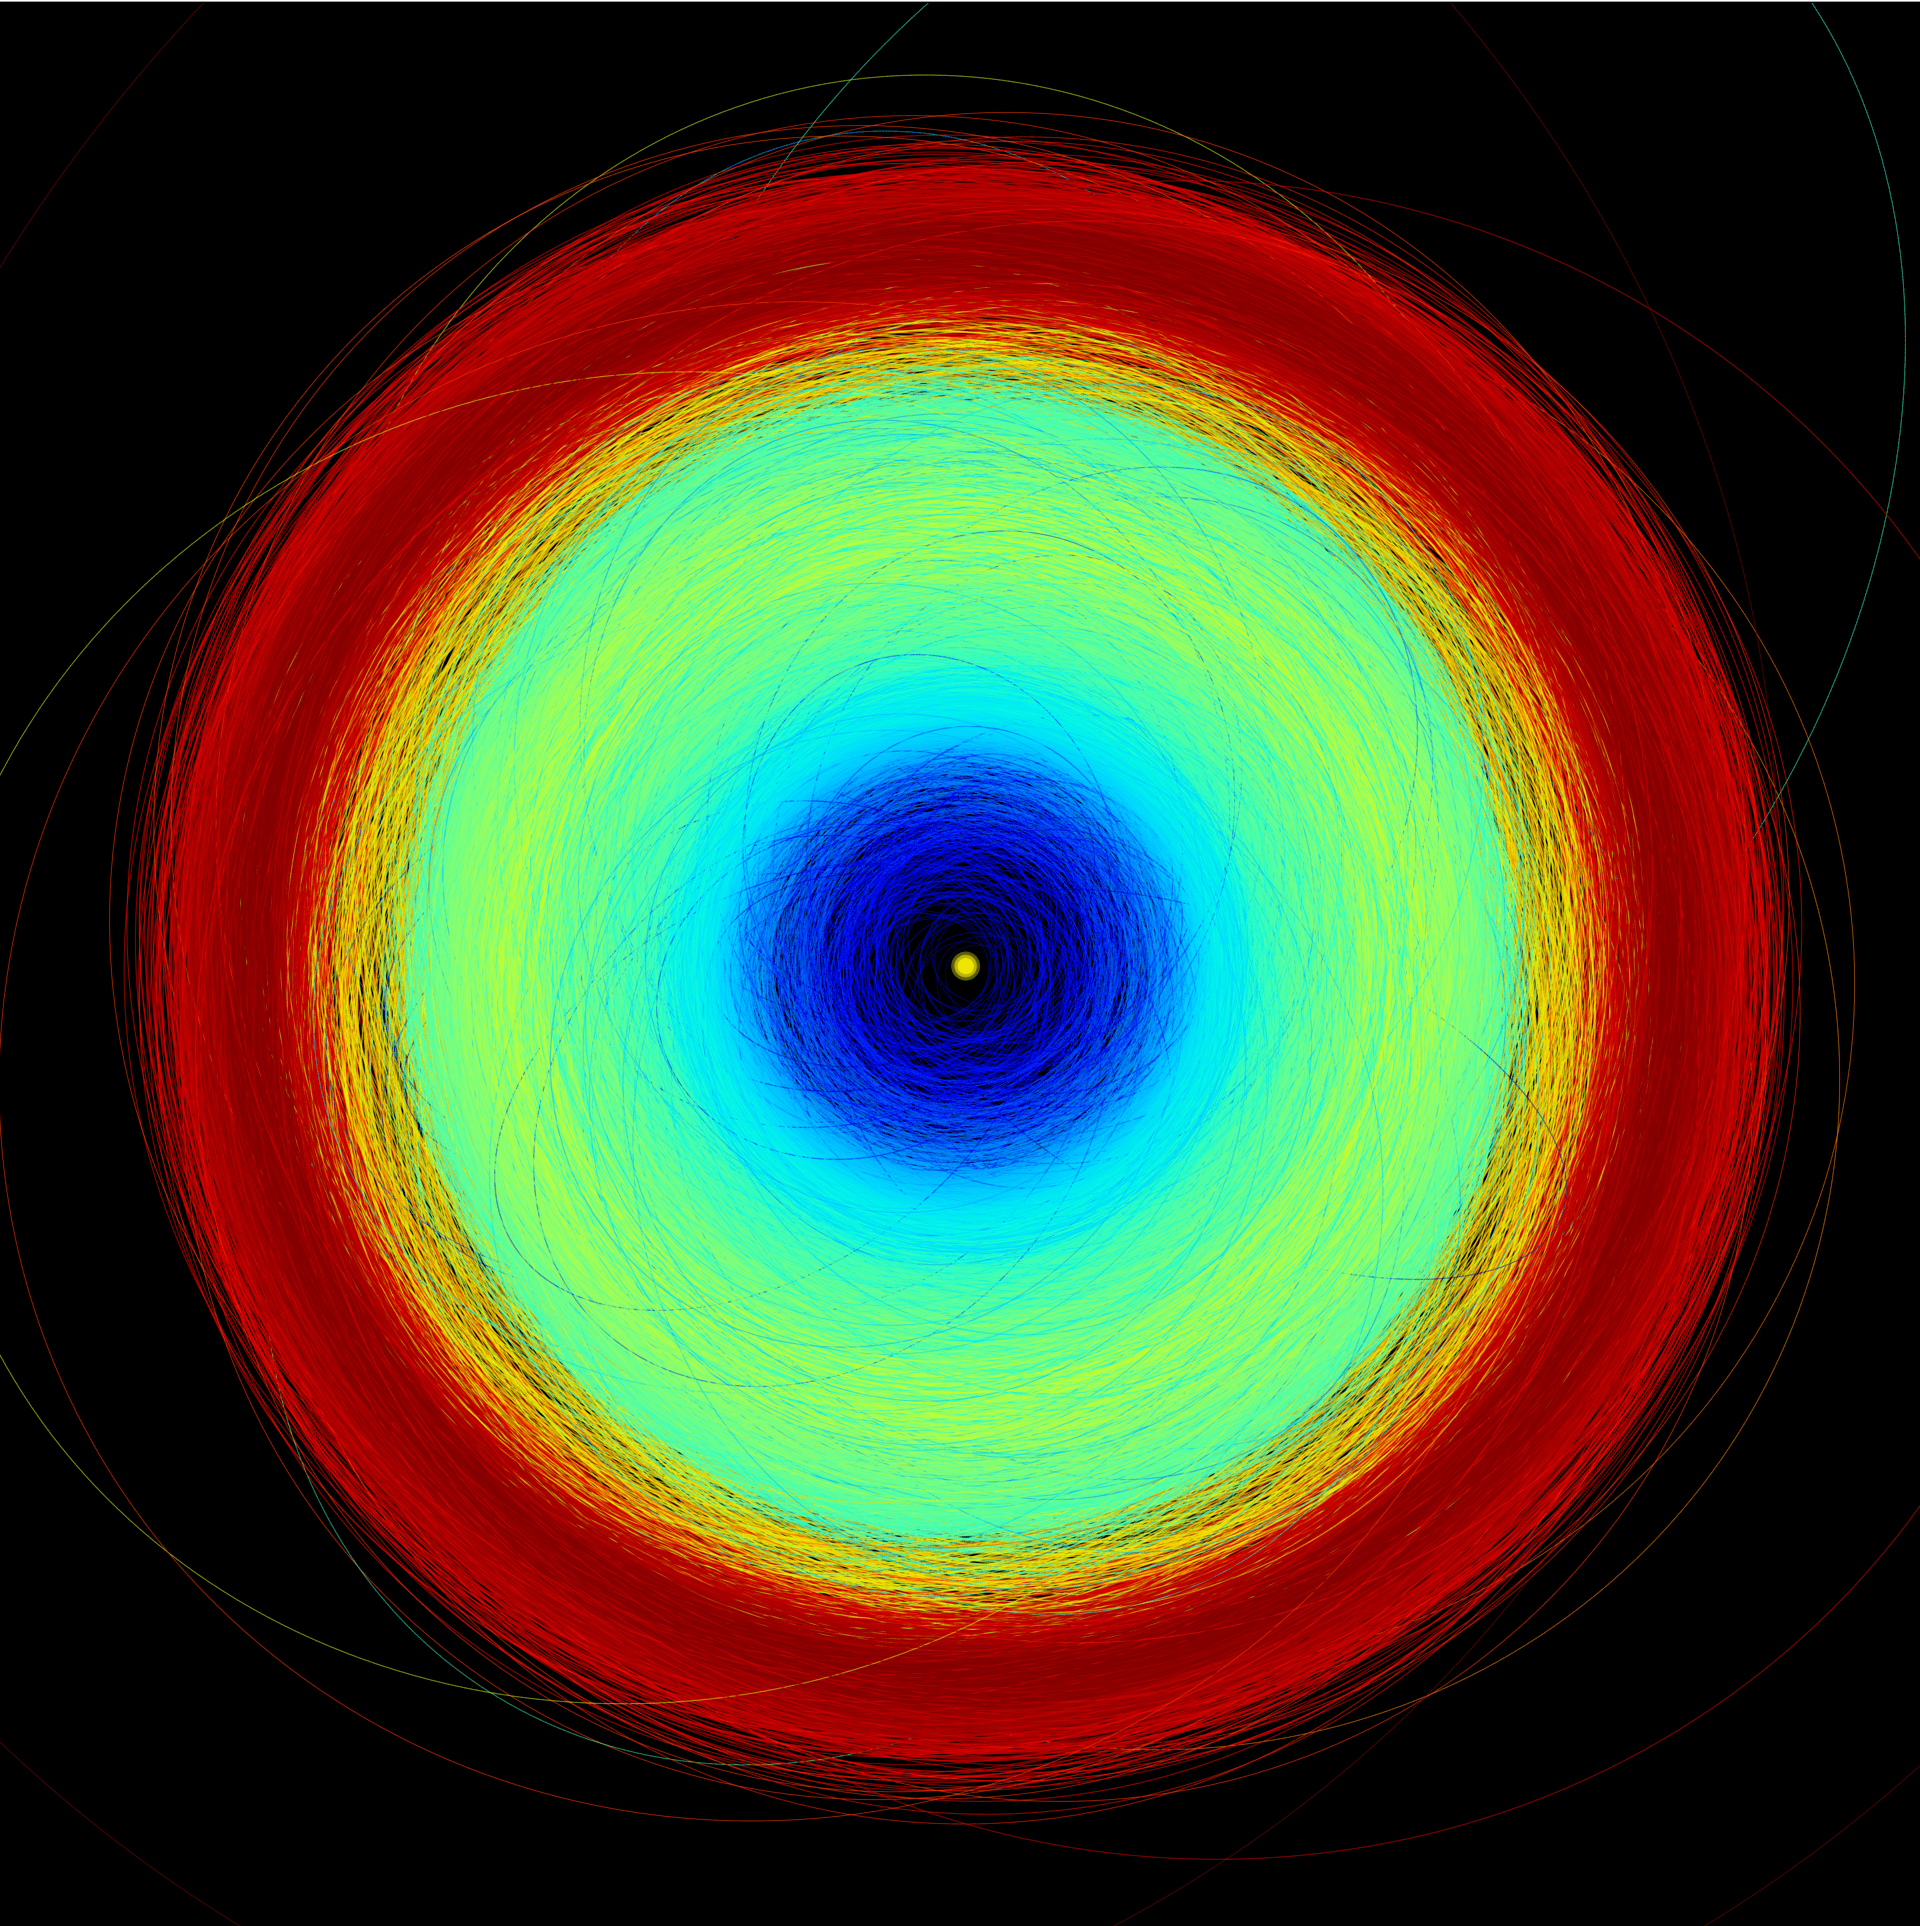
It wasn’t all stars for Gaia’s third dataset. The space observatory also mapped the orbit of more than 150,000 asteroids, from the inner parts of the solar system all the way out to the Trojan asteroids that trail behind, and lead in front of, Jupiter. The different types of asteroids are indicated by different colours.
The yellow dot at the centre of the illustration is the Sun, while the blue represents the inner part of the solar system, with its rocky planets Mercury, Venus, Earth, and Mars, and Near Earth Asteroids, as well as Mars crossers. The main asteroid belt, which lies between Mars and Jupiter, is represented in green, while Jupiter’s Trojans are red.
A closer look at the asteroids
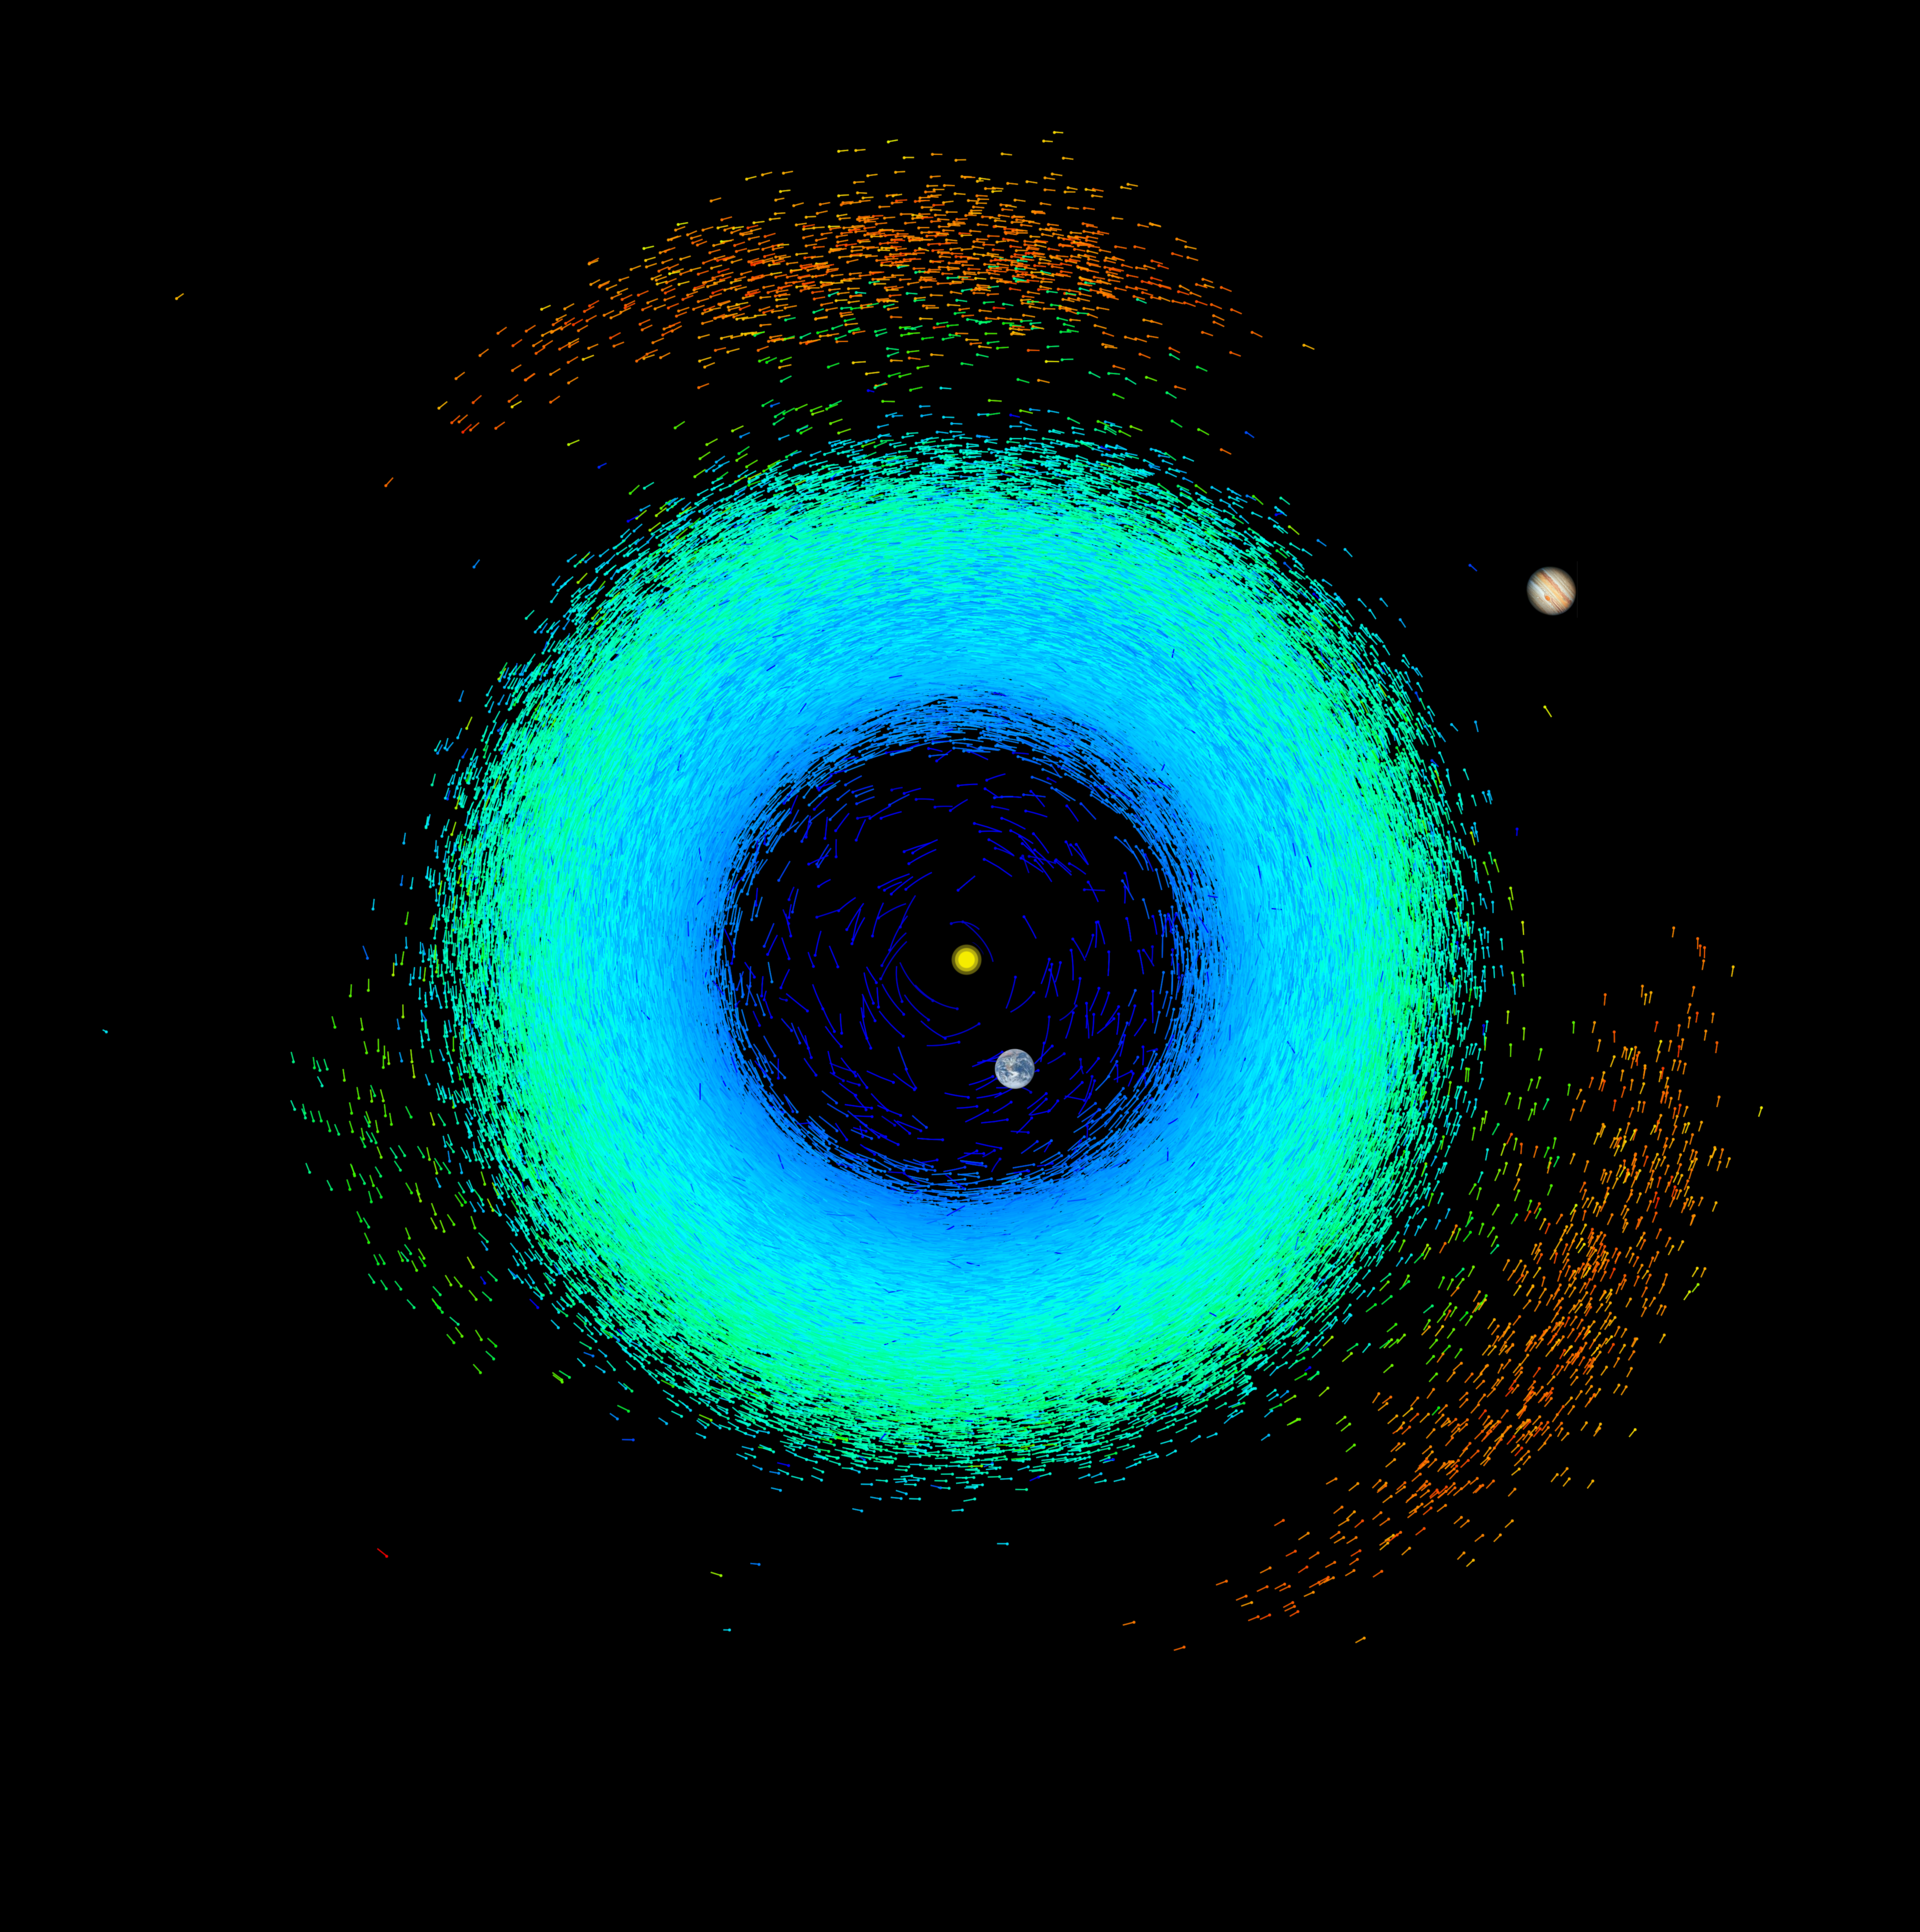
Gaia also captured the positioning of the asteroids on June 13 at 12 pm CEST. The tails show the movement of each asteroid over 10 days.
The inner bodies move faster around the Sun, which is why they are able to complete more of their orbits during that 10-day period.
You are here!

The Milky Way stretches over 100,000 light-years across. Our solar system lies on the edge of the galaxy, giving us a limited view of our cosmic home.
Gaia has recorded billions of objects, but that represents a tiny fraction of the massive galaxy in which we reside. This final illustration shows the area mapped out by Gaia — an incredible feat, but still so limited. But Gaia will remain operational until at least 2025, hopefully providing scientists with many more valuable insights.