It may be winter in the U.S., but it’s always a good time to refresh your innate fear of the creepy crawlies that make us sick. In a new paper this week, John Hopkins researchers have detailed the creation of their Lyme and tickborne disease dashboard. The project provides an easy-to-navigate map tracking the spread of tickborne germs throughout the U.S., along with lessons on why these ticks and the diseases they carry are becoming a more common problem over time.
Mosquitoes may be the most dangerous disease-carrying animal worldwide, but in the U.S., the eight-legged tick now reigns supreme. Lyme disease is the most commonly reported ailment spread by an insect or arachnid in the U.S., and scientists are still discovering new germs that ticks can spread. The threat of tickborne disease seems to be increasing as well, in part due to the effects a warmer climate is having on ticks and the woody environments where they make their home.
Given the growing health significance of these bugs, researchers at John Hopkins wanted to create a new tool for mapping the spread of tickborne illness around the world. They were inspired by the efforts of their colleagues, who had developed a dashboard for tracking covid-19 early on in the pandemic that’s still widely used today.
The first iteration of the Johns Hopkins Lyme and Tickborne Disease Dashboard actually went live in May. But the researchers behind it have published a paper this week in PLOS-One outlining its design and implementation.
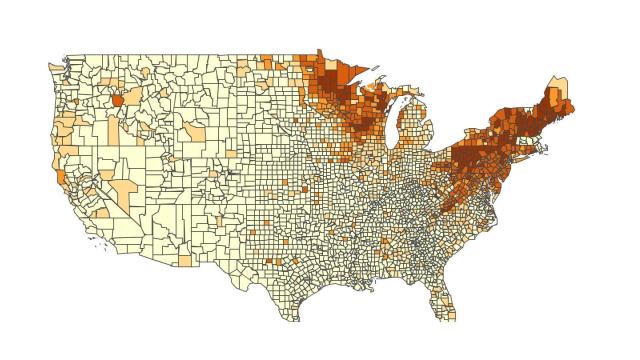
For now, the project is limited to the U.S. and Canada, but it contains a bevy of tick-related data. Its main attraction, the Lyme Map, provides a national, state, and local overview of reported Lyme disease cases and incidence rates from 2000 to 2019. Nationwide, these cases peak around June and July and have been steadily increasing over the past two decades. You can even search up your own county’s Lyme cases.
Elsewhere, you can peruse the project’s data explorer, which will allow you to look at trends not only for Lyme but the many other diseases these ticks can transmit, including babeiosis, anaplasmosis, and Rocky Mountain spotted fever. And you can see the population spread of the two main tick species in the U.S. that transmit illness, Ixodes scapularis and Ixodes pacificus, which blanket the East and West coasts respectively.
Importantly, these reported cases are only capturing a sliver of the harm tickborne germs are causing, the authors note. In 2019, for instance, there were around 35,000 reported Lyme cases. But the true toll that year, according to the Centres for Disease Control and Prevention, was probably closer to 476,000 cases.
Finally, on their Geography, Ticks and You section, you can get a brief explainer on tickborne diseases, including the risk factors that are making them an expanding nuisance. As mentioned earlier, this includes climate change, since it leads to longer summers and warmer winters, allowing ticks to breed and stay active longer each year. But the rise of “fragmented forests” — the breaking up of large forests to make room for suburban human development — can also change the environment in negative ways, such as by increasing the population of natural tick hosts like the white-footed mouse.
Much of the project’s design is meant to be easily grasped by the general public. But the collection of all this data, often pulled from local health departments or universities running tick surveillance programs, in a single location is also supposed to be a boon for fellow tick researchers in the future. And the team does plan to expand globally to cover the threat of ticks everywhere.
“We envision the dashboard becoming a global tracker of tickborne diseases, which will not only help to communicate to different users worldwide (e.g., public health, advocacy, donor, and funding organisations) the increasing global impact of these diseases but also serve as a resource to researchers who study their spatial variation,” they wrote.