From rooftop configurations to utility-scale facilities, solar panels are springing up like popcorn across the United States. Putting an exact figure on the nation’s total solar power output, however, is proving to be notoriously difficult.
Thankfully, it’s a problem well suited to artificial intelligence, as new research from Stanford University shows.
In some states, solar energy accounts for upwards of 10 per cent of total electricity generation. It’s definitely a source of power that’s on the rise, whether it be to lessen our dependence on fossil fuels, nuclear power, or the energy grid, or simply to take advantage of the low costs.
This form of energy, however, is highly decentralized, so it’s tough to know how much solar energy is being extracted, where, and by whom.
“Currently, there is no scalable way to build a complete national map of the adoption of solar systems, particularly rooftop PV [photovoltaics], including precise locations and panel sizes,” said Ram Rajagopal, a civil engineering professor at Stanford and the co-author of a new study published today in the science journal Joule.
“Such maps help utilities, system operators, policymakers and tech vendors understand the adoption patterns of solar systems. We wanted to develop a methodology that could be applied in most countries in the world and required limited human intervention.”
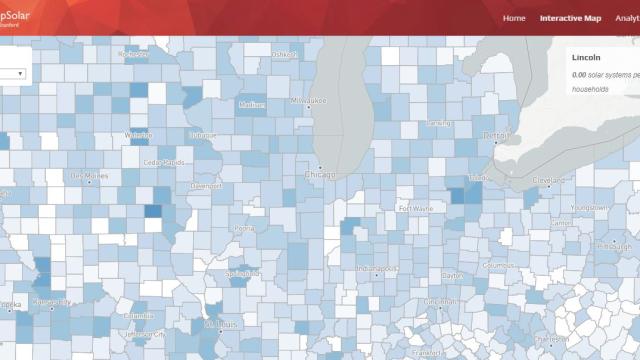
The system developed by Rajagopal, along with his colleagues Jiafan Yu and Zhecheng Wang, is called DeepSolar, and it’s an automated process whereby hi-res satellite photos are analysed by an algorithm driven by machine learning. DeepSolar can identify solar panels, register their locations, and calculate their size. The system identified 1.47 million individual solar installations across the United States, whether they be small rooftop configurations, solar farms, or utility-scale systems.
This exceeds the previous estimate of 1.02 million installations. The researchers have made this data available at an open-source website.
By using this new approach, the researchers were able to accurately scan billions of tiles of high-resolution satellite imagery covering the continental U.S., allowing them to classify and measure the size of solar systems in a few weeks rather than years, as per previous methods. Importantly, DeepSolar requires minimal human supervision.
“The algorithm breaks satellite images into tiles. Each tile is processed by a deep neural net to produce a classification for each pixel in a tile. These classifications are combined together to detect if a system—or part of—is present in the tile,” Rajagopal told Gizmodo.
The neural net can then determine which tile is a solar panel, and which is not. The network architecture is such that after training, the layers of the network produce an activation map, also known as a heat map, that outlines the panels. This can be used to obtain the size of each solar panel system.
“A rooftop PV system typically corresponds to multiple pixels. Thus even if each pixel classification is not perfect, when combined you get a dramatically improved classification,” said Rajagopal. “We give higher weights to false negatives to prevent them.”
Equipped with this information, researchers, policy makers, and civil planners will be able to correlate this data with other factors, such as household income, population density, and education level. The resulting analyses could steer infrastructure upgrades, whereby the U.S. power grid could be made more compatible with solar sources, which are prone to seasonal fluctuations in incoming sunlight, or the odd solar eclipse.
The data could also show which areas are in need of solar deployment, which regions are susceptible to cultural and ethnic disparities, and to predict which geographic regions are most likely to adopt solar energy on account of socioeconomic factors.
“We hope the data produced by DeepSolar can aid researchers, policymakers, and the industry in gaining a better understanding of solar adoption and its impacts,” write the authors in the study.
For Rajagopal, the most surprising aspect of this research was that the system could accurately detect solar panels in such a short amount of computing time. He was also impressed by how he and his colleagues were able to see significant trends in the data. For example, peak deployment of solar panels was shown to happen in areas with a population density of 1,000 people per square mile, and 4.5 kWh/m2/day appeared to be the threshold for incoming sunlight (solar radiation), above which solar deployment was practically a given.
And as the authors write in the study:
Annual household income is a substantial driver for solar deployment. Low- and medium-income households have low deployment densities despite solar systems being profitable for high-radiation rates [areas with good sunlight], indicating that the lack of financial capability of covering the upfront cost is likely a major burden of solar deployment.
In terms of limitations, the solar power map is only as good as the most recent data processed by the DeepSolar system. Given the rate at which Americans are installing solar panels, this map is already out of date. What’s more, the map can’t really tell us the efficiency of each solar panel, and the amount of energy being extracted and utilised.
Also, the creation of these maps required a significant use of cloud computing resources — costs that Rajagopal described as being “non-trivial.” DeepSolar is considered a scalable system, but improvements need to be made in terms of its real-time accuracy and costs.
Looking ahead, the researchers would like to use the technology to produce solar maps for many countries around the world. Additionally, a similar method could conceivably be used to locate wind turbines and other energy infrastructure components. Finally, the researchers are also working on a tweak that would allow the system to calculate the angle of solar panels, which would improve estimates of power-generation.
The method devised by these Stanford researchers is a good start, and clearly important given the direction that solar power seems to be headed. The more information we have about such things, the better.
[Joule]