Climate change is happening all around us, but when your life is far more driven by the day-to-day weather, it can be hard to grasp the reality of a process playing out incrementally, globally and over the course of generations. It’s much easier if you have a compelling visualisation — and thankfully, one climate scientist with a flair for data design has made one.
Earlier this year, Ed Hawkins, a climatologist at the University of Reading and contributing author to recent reports by the Intergovernmental Panel on Climate Change, produced a rather mesmerising visualisation that showed global temperature anomalies spiraling upwards. The graphic was simple, elegant and an immediate internet sensation.
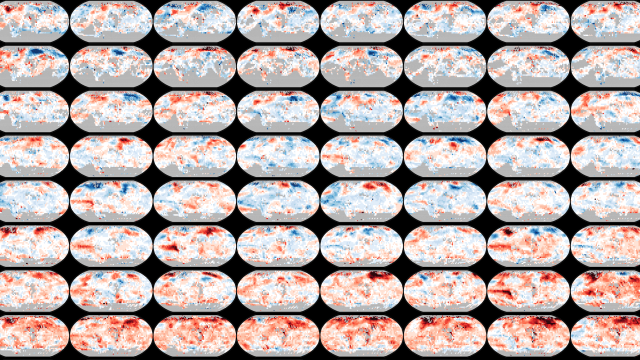
Now, Hawkins has told the story of our planetary heatwave in a different way: Using a technique called small multiples to produce 167 tiny, adorable maps. Pulling data from the UK Met Office for every year from 1850 to 2016, Hawkins has mapped out Earth’s annual temperature anomalies from before the American Civil War to the age of selfie sticks.
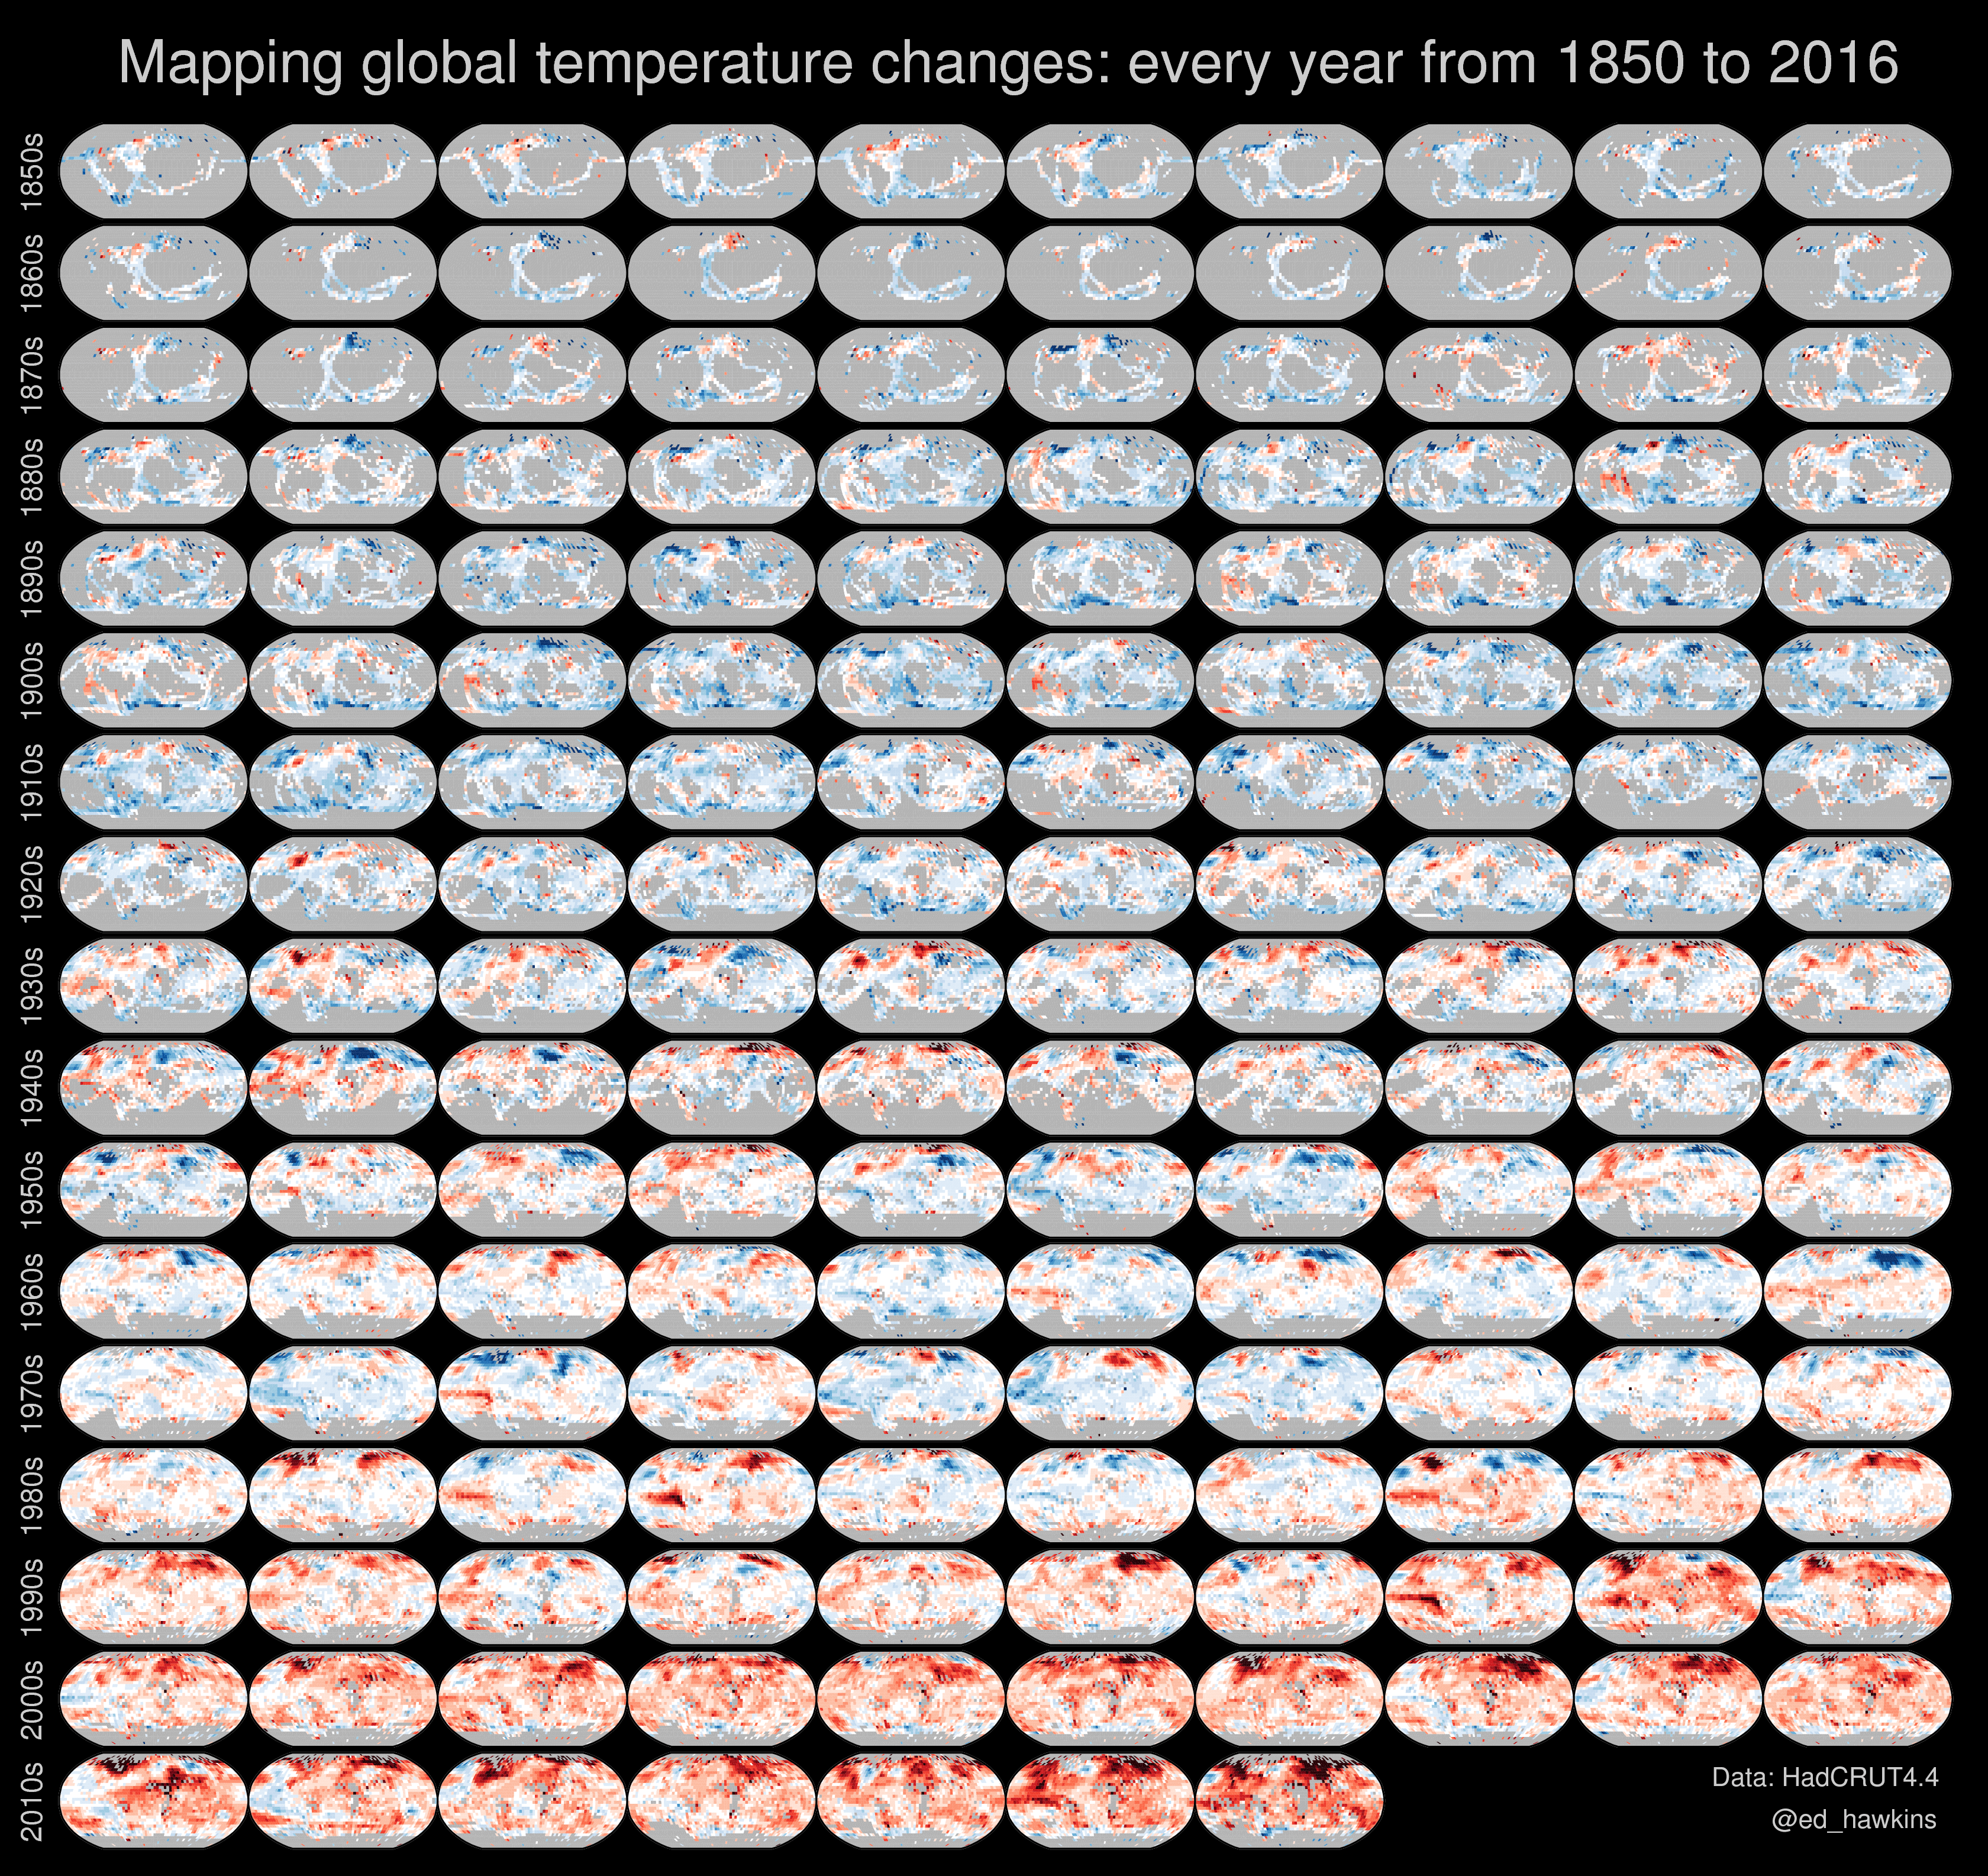
Image: Ed Hawkins
At a glance, the visualisation is like a pastel study in blues and reds, with a distinct warming trend visible over time and especially in the last few decades. But there are loads of nuanced climate-related patterns to dissect here as well, and if you’re a data geek it’s worth pouring over the entire thing in high resolution. The lack of data in the earlier part of the record (as indicated by grey) speaks to the limited number of meteorological stations before the 20th century, while the comings and goings of El Niño produces blips of heat in the equatorial Pacific that fizzle out into the longer-term trend.
And if you live in the Arctic, and can’t understand why the rest of us aren’t grasping the reality of climate change, here’s proof that you really have had it worse.
“My previous global temperature spiral helps communicate that the globe as a whole has warmed,” Hawkins told Gizmodo in an email. “The small multiples highlight that nearly every region has warmed, which links to people’s everyday experiences in their own location and makes climate change more relevant on an individual level.”
[h/t Climate Central]