
Contrary to what New Yorkers would like to tell you, Los Angeles is freaking old. Older than the United States of America, in fact. And it’s easy to see just how old the city is with built:LA, an interactive map that colour-codes the age of over three million LA buildings.
Each building is assigned a colour value for the decade when it was built, from the light blue of anything built in the early 20th century or before, to the orange of 21st century buildings (it only includes new buildings that were finished by 2008). If you roll over a specific property, you’ll get the exact year, however, you can’t search for a property beyond just zooming in and feeling your way around.
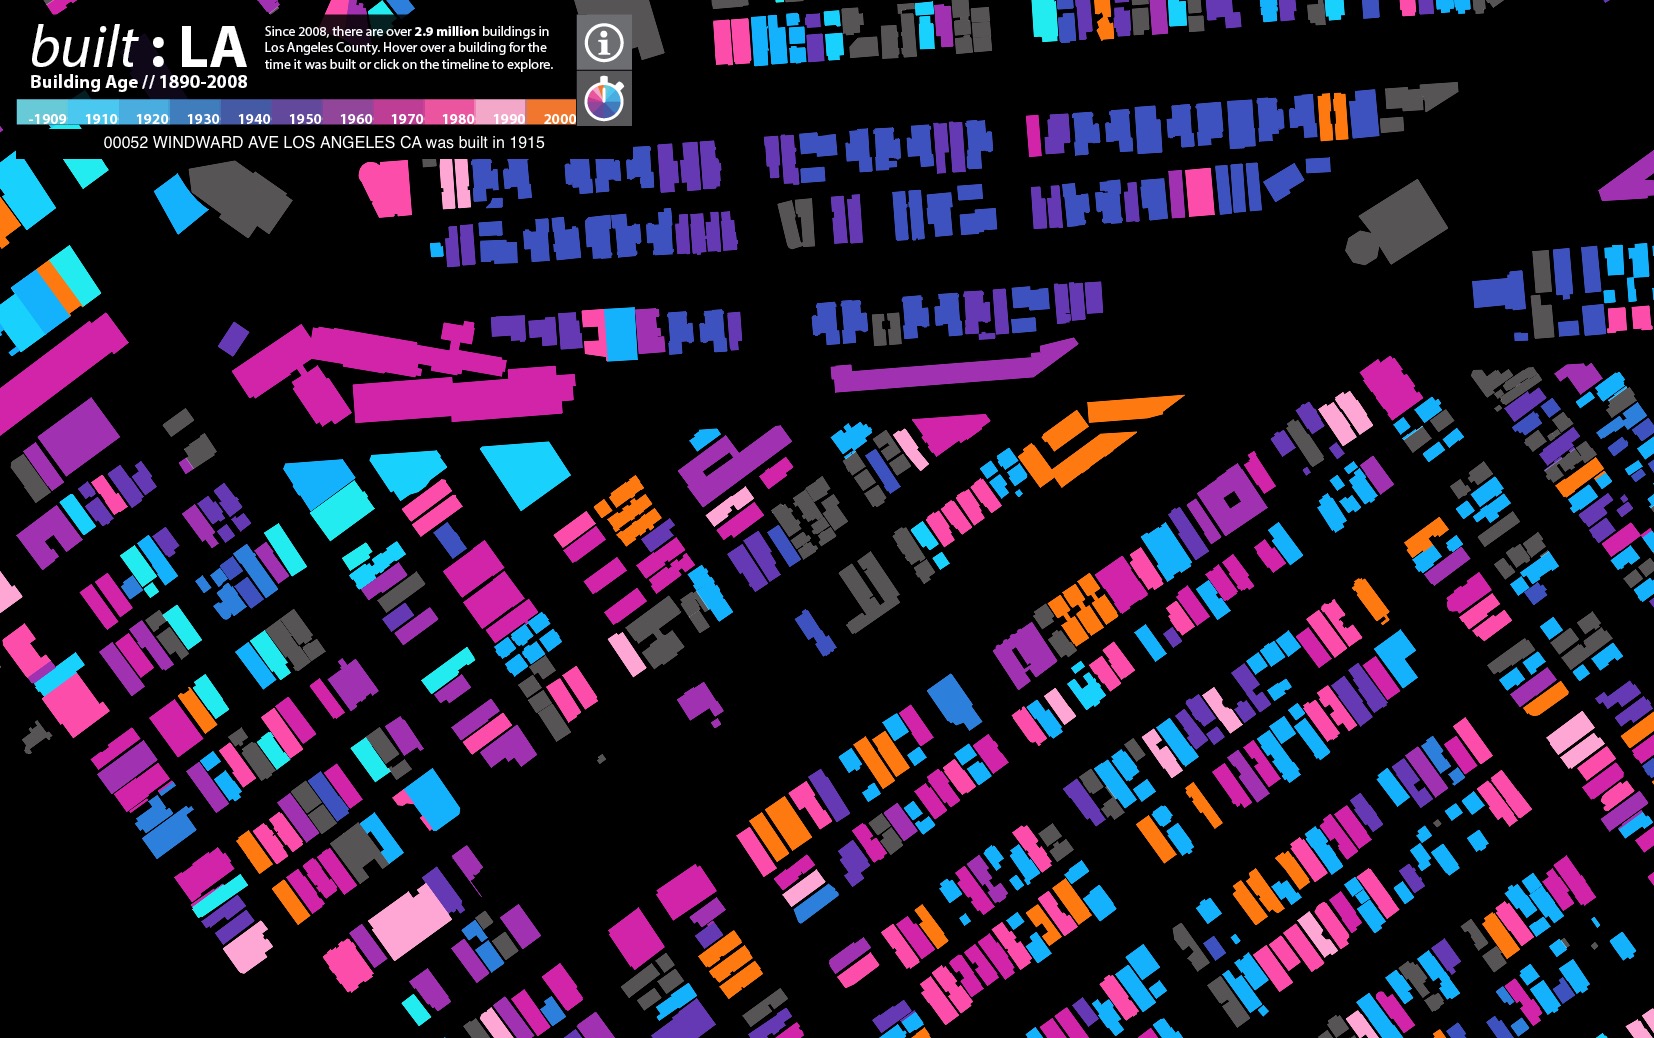
The map shows pretty much every building in LA County. Those with greyed-out footprints didn’t have any available data (my home is unfortunately one of those). But you’re still able to get a fairly complete picture of the way any neighbourhood was planned.
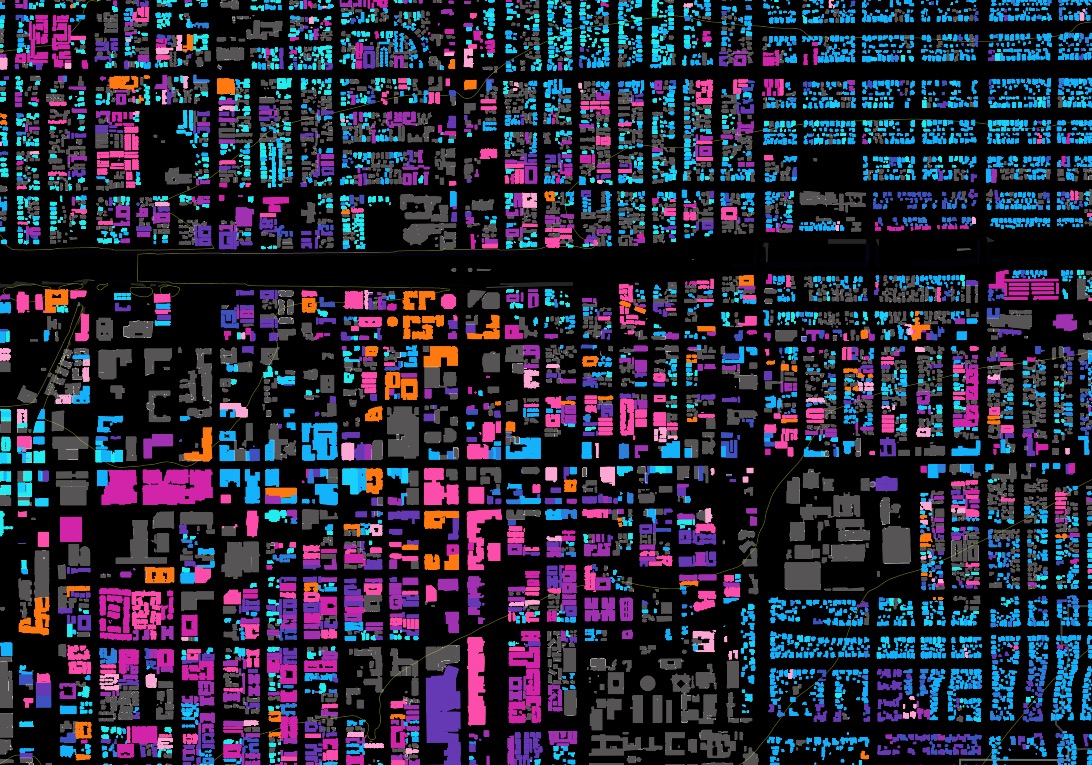
Here’s downtown Pasadena:
Using the map you can scroll through the decades to watch the city grow, or hit that colour wheel-looking thing to watch it animate. I had so much fun moving around the city and highlighting certain decades. Just poking around the map you can tell so much about LA.
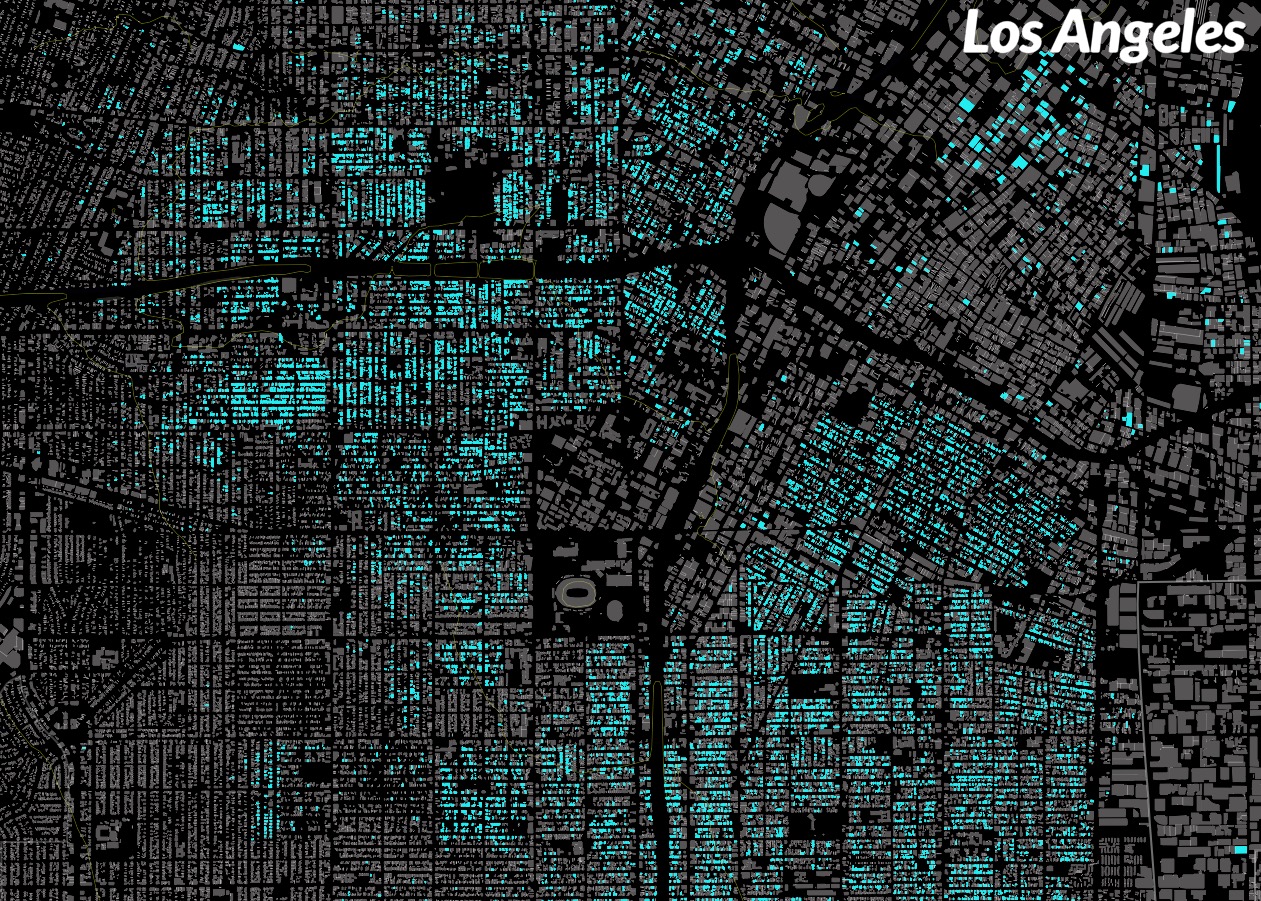
The highest concentration of still-intact pre-1909 buildings are southwest of downtown:
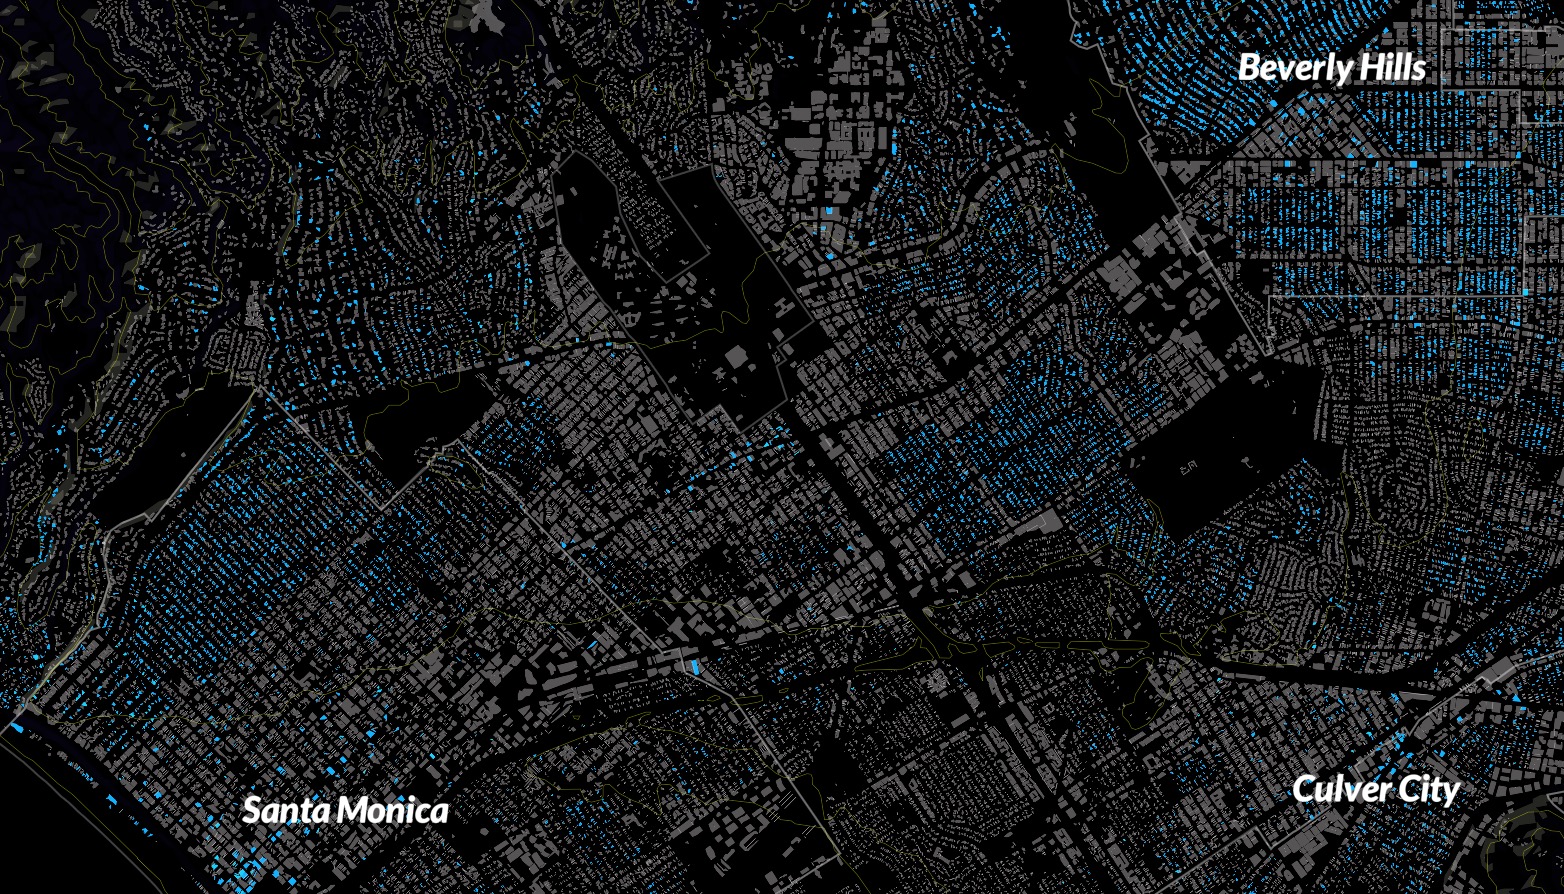
Much of the city’s westward growth happened in the 1920s:
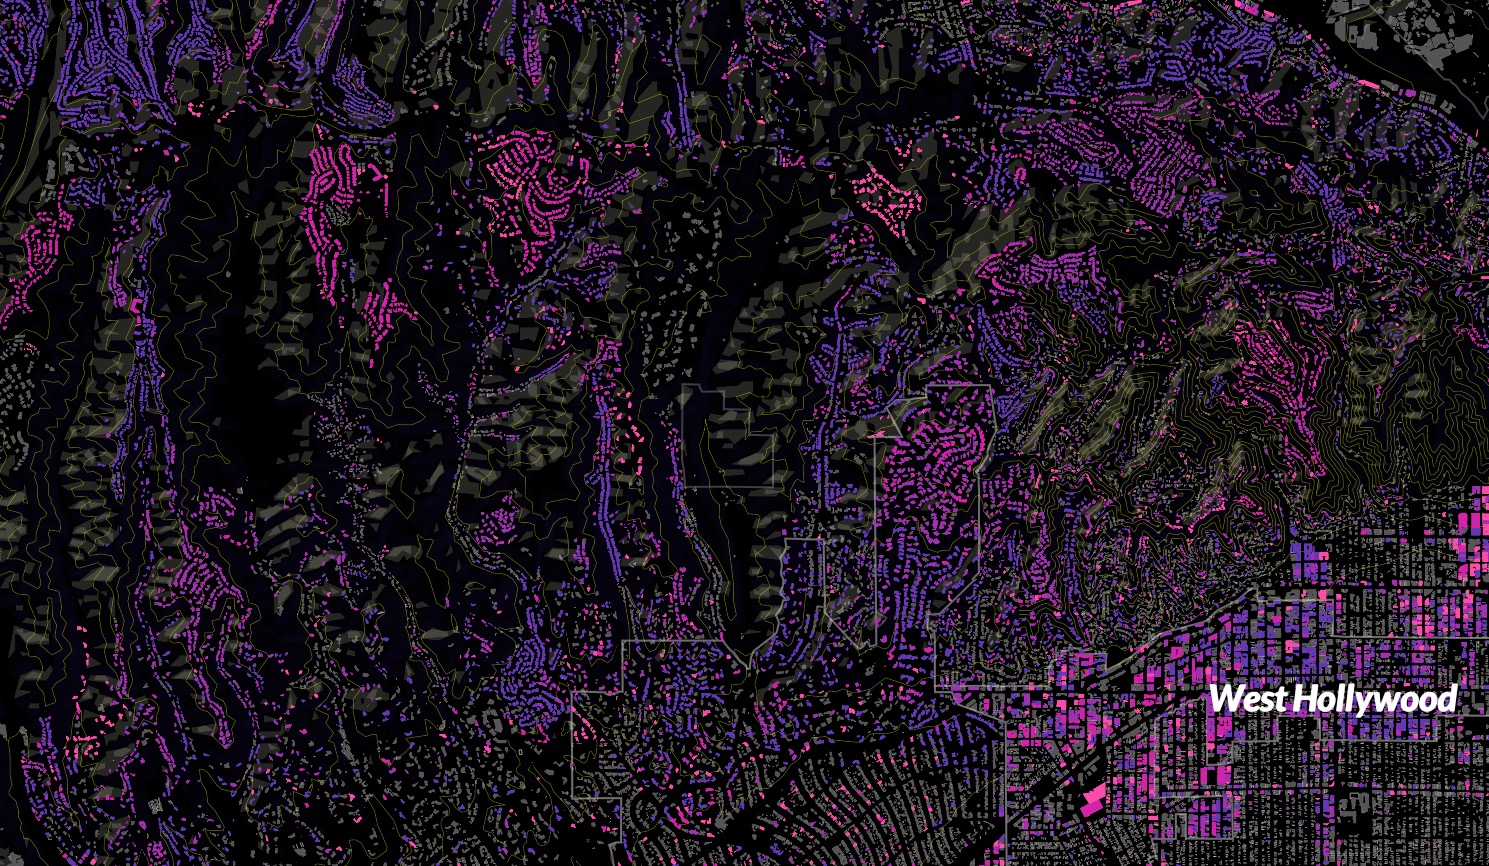
People didn’t really start moving into the hills until the 60s and 70s:
According to CityLab, built:LA was made possible thanks to public data. It was developed by the Urban Policy Collective using several open data sets from the LA County GIS Data Portal and LA County Assessor Local Roll. (It’s inspired by a similar map of Portland, Oregon.)
It’s amazing to think how this could be used in conjunction with a new site, HistoricPlacesLA, that catalogues not only the age but architectural style and cultural significance of every property in the city. Time to put together a walking tour of all the pre-1909 buildings in my neighbourhood.
The map was made by Omar Ureta of the Urban Policy Collective @ Roschen Van Cleve Architects. He made it with with OpenStreetMap using Mapbox Studio and Mapbox-GL and all the code is available at Github.