The U.S. National Oceanic and Atmospheric Administration wants us to know it’s not the 1980s anymore. On Tuesday, it announced new 30-year averages for temperature and precipitation in the U.S. Unsurprisingly, the “new normal” is hotter.
NOAA’s National Centres for Environmental Information update what it considers average every decade. For the past decade, the U.S. has used normals based on weather observations from 1981 to 2010. Now, “normal” is 1991 to 2020. That will serve as the new baseline for comparing the weather to recent history, whether it’s the daily high or the annual average precipitation gathered at more than 9,000 daily weather reporting stations around the country.
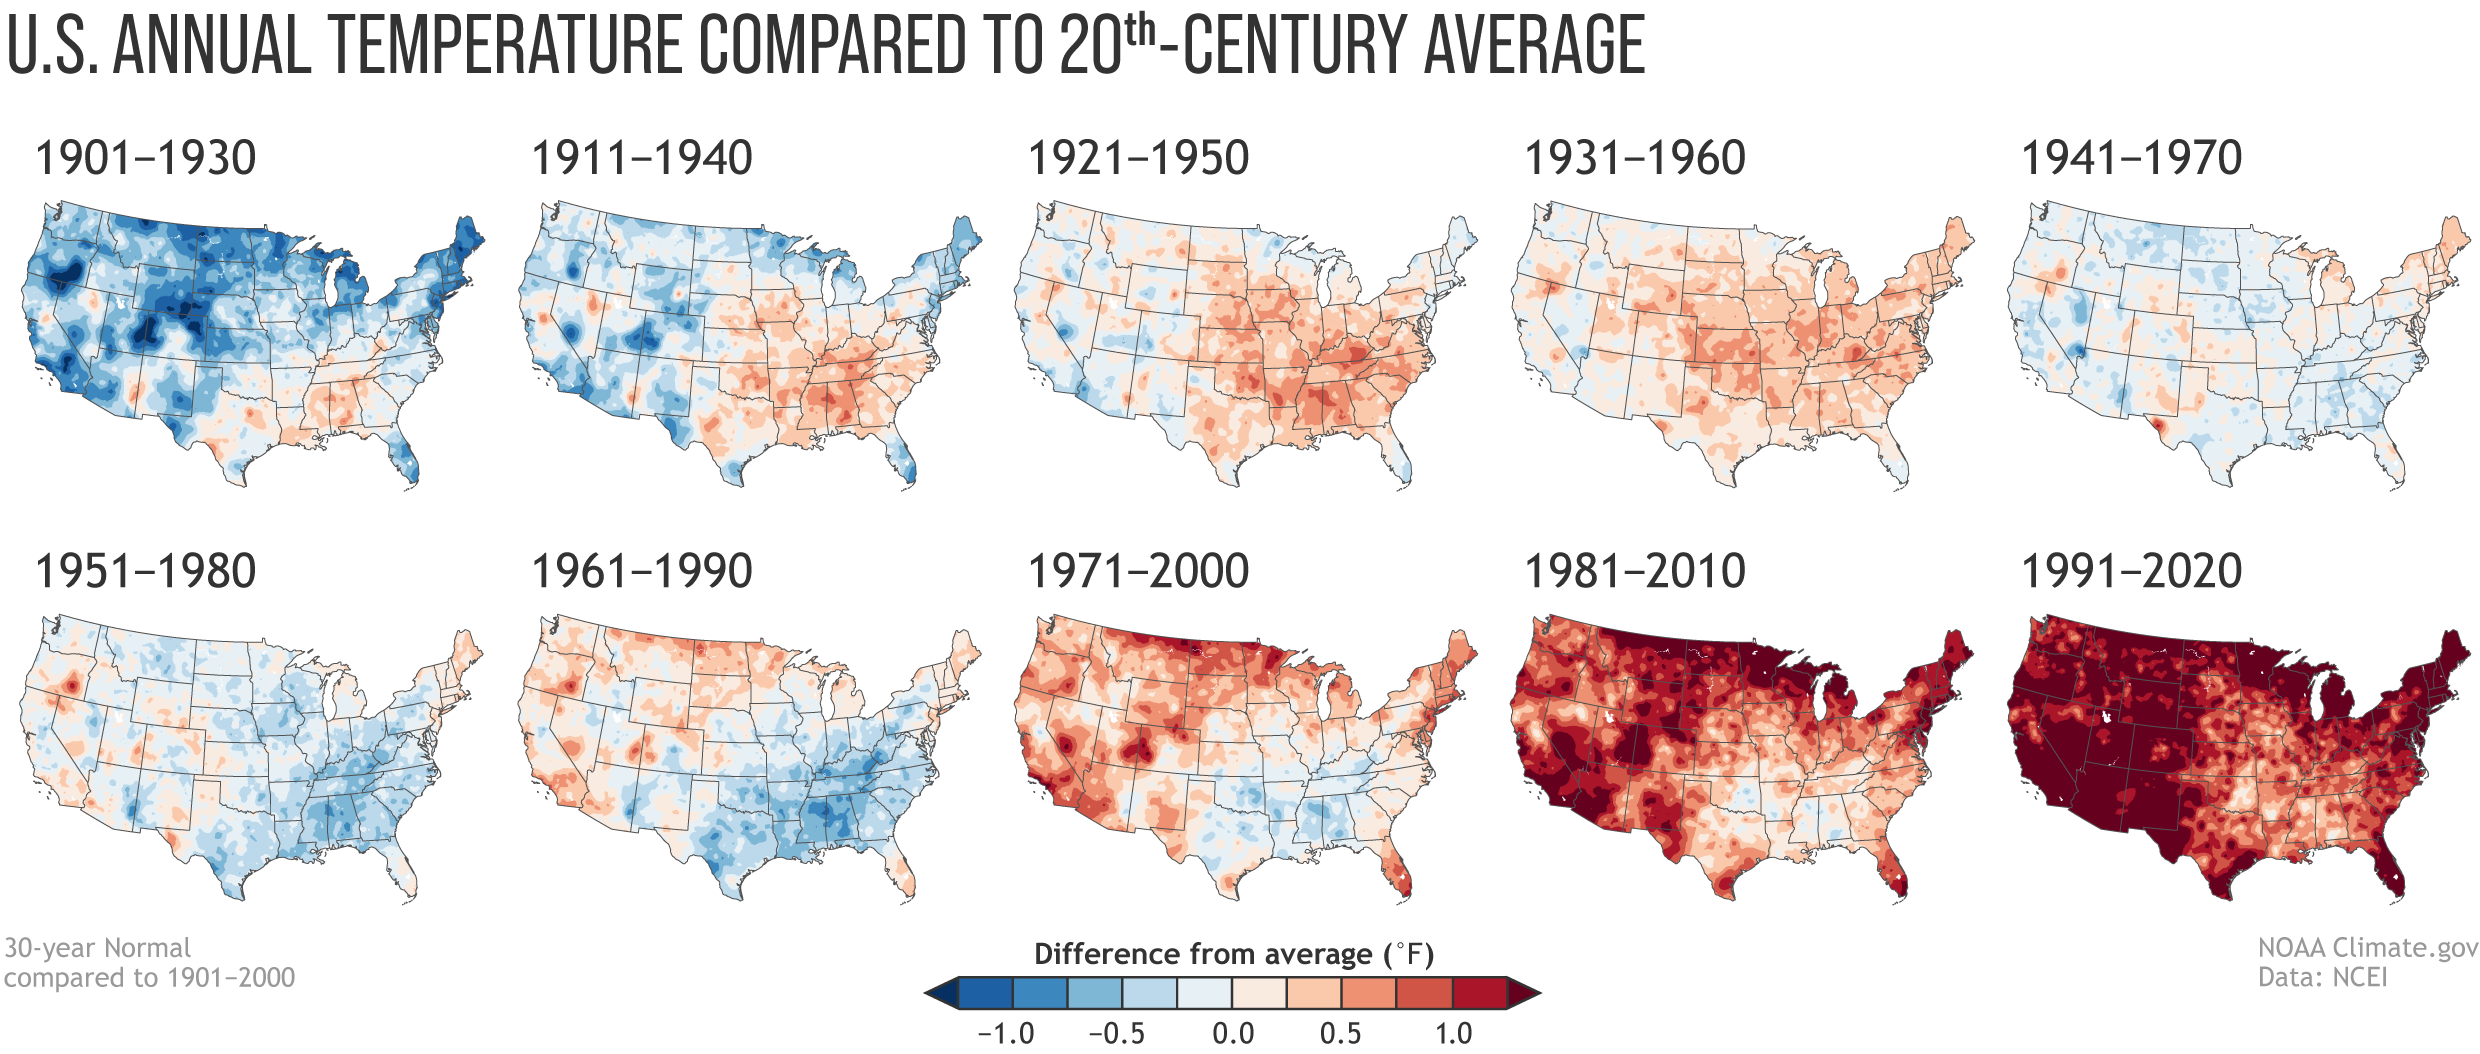
The nation illustrated by the new climate normals is hotter than the one displayed in the ones from the recent past. The majority of the contiguous U.S. was hotter from 1991 to 2020 than it was from 1981 to 2010, and the 30-year average temperature for the contiguous U.S. was 53.28 degrees Fahrenheit (11.82 degrees Celsius, and yes, NOAA does take it to the hundredth of a degree). The agency confirmed that’s a record high to the Washington Post. Much of the country also got wetter: The eastern two-thirds of the nation saw more precipitation overall.
The average temperature in the Lower 48 is 0.46 degrees Fahrenheit (0.26 degrees Celsius) hotter over the new normal period compared to the 1981 to 2010 normal. What may appear as a small change belies a big uptick in extreme heat as it pushes the hottest days into uncharted territory and makes formerly record-setting heat waves more common.
The northern Great Plains were among the only places to get slightly cooler. But Sean Sublette, a meteorologist at the nonprofit Climate Central, said in an email the “signal disappears” when taking history into account given that they’ve warmed extensively over the course of the 20th century. As for the cause, he said it might be due to the rise in corn planted and what’s “colloquially known as ‘corn sweat’ [where] the plants give off more moisture from their leaves … which leads to more evaporation, which has a cooling effect (like when you get out of a pool).”
Bernadette Woods Placky, chief meteorologist with Climate Central, said that the upward trend in temperatures is consistent with what we know about how the climate crisis has been progressing.
“It’s important to distinguish between the newest set of normals, which updates every 10 years, with the longer-term changes that we are seeing in our warming planet,” she said. “Even in the past 10 years, most of the country is warming with the exception of the Northern Plains where temperatures have slightly dipped. But this is also an opportunity to pause and take a look at the bigger picture, the continual uptick in temperatures since the late 1800s. When you take a look at the bigger picture, the warming is striking.”
The agency also updated its new normal for hurricane season earlier this year, showing the Atlantic basin is seeing more storms. Apart from meteorology, these averages have a wide range of other applications, too.
“Keeping normals relevant with the current climate is important in making informed decisions for local governments and businesses,” said Woods. “For example, farmers need to know when to plant crops and what types of crops to plant; city planners need to know how to budget for snow removal and opening cooling centres; utilities, construction companies, and the travel industry also make plans around current and expected climate.”
The data points are also used to regulate power companies and forecast energy load needs. They also present an important way to learn about how U.S. weather has shifted and reflect on how urgently we need to change the course of the climate crisis. Though the changes seen in these 30-year climate normals are small, they show that the climate crisis is anything but normal, and that we need to take it on urgently.
“This is a sign of our changing climate,” said Woods.