Last week, a team of intrepid storm chasers converged near Corpus Christi, Texas to witness the landfall of Hurricane Harvey, the storm that’s brought over 127cm of rain to the Texas Gulf Coast and major flooding to the city of Houston. But these researchers collecting data for the National Oceanic and Atmospheric Administration (NOAA) didn’t just get the usual storm readings. They obtained weather balloon data they say have never before been collected from a hurricane in the history of the agency. Eventually, they hope the information acquired will help improve forecast models and prevent future disasters such as the flooding in Houston.
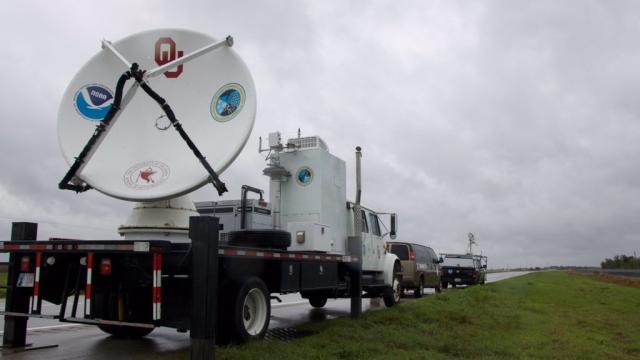
Oklahoma University sent a radar truck to track Hurricane Harvey up close. Image: Addison Alford/Oklahoma University
As these things normally go, the call to head out into the growing storm came at the last minute. “So pretty much any weekend plans or anything that I had going at work was on hold to drive down there,” said NOAA’s National Severe Storms Laboratory (NSSL) storm chaser and PhD research meteorologist Sean Waugh.
On Thursday, August 24, Waugh hopped in a highly modified blue Dodge Ram packed with weather sensing instruments to go and size up Hurricane Harvey, which was still gathering steam in the Gulf of Mexico. He was joined by a team of Oklahoma University meteorologists, including OU professor Mike Biggerstaff, research scientist Gordon Carrie, and PhD student Addison Alford, in a separate mobile weather radar truck.
With all the OU team in one truck it was “a bit cramped,” said Alford. “The A/C doesn’t work either, so that makes it even more uncomfortable. However, we were in good spirits and were excited about the data we were collecting.”
Waugh and the OU weather team left from the NSSL headquarters in Norman, OK, and drove seven and a half hours to end up to the west of Rockport, Texas, which experienced the brunt of the storm. They eventually hunkered down and picked a safe spot near Woodsboro, a town of less than 1500 people, to park the radar truck. Early reports were already calling the storm unprecedented for the Gulf Coast region.
At 10PM local time Friday night, Harvey hit the coast as a Category 4 Hurricane. It passed over San Jose Island, and brought 209km/h winds and a 4m storm surge with it.
By midnight on Friday, it was clear the team needed a closer look.
Waugh and Alford took off in the Ram and found a parking lot in Refugio, Texas at the junction of Highway 77 and 183. This was a slightly calmer area than the coast where storm had made landfall about 32km away.
It was the start of the worst rain and flooding the continental United States had ever seen, but the details on the full scope of the devastation wouldn’t be known for a couple days. All Waugh and Alford could do was anticipate when the next burst of rain and wind would hit their truck. “Raindrops at 70 to 80mph hurt, so you spend most of your time inside the vehicle, cramped and unable to really sleep at all,” said Waugh.
“Watching the storm come in, making sure all of the instruments are still working, making sure that you’re set up in the right spot for both data collection and safety, you don’t have time to let your guard down,” he added.
NOAA refers to a vehicle like Waugh’s modified Ram as a “Mobile Mesonet“. Much like the meteorological observation towers found across Oklahoma, it features a collection of remote-sensing equipment which collect weather measurements. It’s also able to launch something called a radiosonde, a device about the size of a Pop-Tart box, attached to a massive weather balloon about 1.8m in diameter. Radiosondes can collect up-close observations of the wind speeds, temperature, pressure, humidity and other conditions found inside the hurricane. This data collection is called a “sounding”.
Waugh had already performed two balloon soundings earlier in the day, but now that the storm was practically on top of them, conditions had become considerably more hostile. Eventually, the two realised they were going to have to leave the relative safety of their truck. “I helped Sean to hold the balloon down while he attached the radiosonde. I wouldn’t call it scary launching the balloon,” said Alford. “The scariest part was driving. Sean did an amazing job and was extremely cautious when driving through the eyewall, where the strongest winds were located.”
After finally releasing the balloon at 2:15AM, Waugh and Alford could not have expected the incredible results they got back. It was a bullseye; the sounding had entered the eye of Harvey and raced along its wall, producing a circular trajectory on their graphs. “There have been soundings launched into hurricanes but they’re usually in the outer rainbands,” said Waugh. This was the first time one was launched from the ground into the eyewall of a hurricane, he said.
During the sounding’s ascent of over 9km, it found wind speeds of about 113km/h. But what blew the meteorologists away was the amount of precipitable water in the atmosphere.
Precipitable water is the total amount of water that could potentially fall from a column of air. During heavy storm events, the value is typically around 2.5 to 4cm. In the course of verifying what they found, Waugh went back and checked the historical data. “I think I saw a few extreme peaks up to maybe two-and-a-half [inches, 6.3cm],” he said, adding that even those values were extreme outliers.
During Harvey, Waugh and Alford measured a precipitable water value of 8cm. Initially, the team was shocked. Waugh couldn’t confirm it without more investigation, but he’s pretty confident that is the largest amount of precipitable water ever recorded in the continental US. Of course, it turned out to be a harbinger of the wettest tropical storm event in US history.
In the end, the weather balloon actually circled directly back over the heads of Waugh and Alford as they observed the effects of the storm on the coast. Even with this incredible data in hand, their job was not over yet. “We stopped operating at about 9:00AM Saturday morning,” said Waugh. “We’d been up for over 24 straight hours at that point.”
By Saturday morning, Harvey had moved inland and the eye had dispersed. While Harvey’s intensity had declined and it was subsequently downgraded to a tropical storm, it remained stationary over the Texas coast, causing rainfall and floodwaters to ramp up in Houston.
As the researchers headed back to their hotel in Beeville, Texas, Waugh and the OU team knew they had something special — getting this sort of data elevated the scientific understanding of the storm’s mechanics. And they believe it will improve our predictive modelling of severe tropical storm events in the future.
“Where do [hurricanes] derive their energies from? How is it able to produce this much rain?” Waugh pointed out that while the forecast models largely got Harvey right, the ability to go back and compare those models with data collected in the heart of the storm “is a huge benefit”.
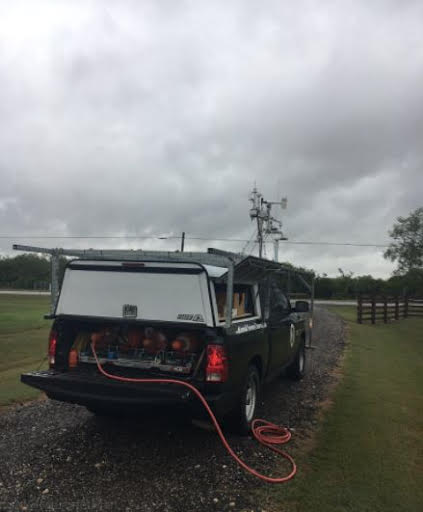
The view of the radar truck as the storm was just about to hit the coast of Texas. Image: Addison Alford/Oklahoma University
Alford echoed Waugh’s sentiments. As they combined the data from their radar truck with that of the National Weather Service, they were able to create three-dimensional views of the winds in the eyewall as it made landfall. “The greatest loss of life during hurricanes is from inland flooding, and we hope our observations will help lead to improved forecasting of hurricane intensity, track, and precipitation in the future,” he said.
The storm chasers are now safely back at home in Oklahoma and are processing what they have learned. “What this has shown is that — like most things in weather — you go in with one question and come out with 10 more,” said Waugh.
Repeating the same weather observation in the same environment can result in different data. “It’s going to make us want to look at other storms. Is this type of pattern consistent or was this one really rare?” said Waugh, sounding eager to drive into the next big one.