It’s been a hot, thirsty, fire-ridden summer in the western United States. But to really understand the severity of the drought, we need to look beneath the parched vegetation and deep into the ground. Spoilers: It’s looking awfully dry down there.
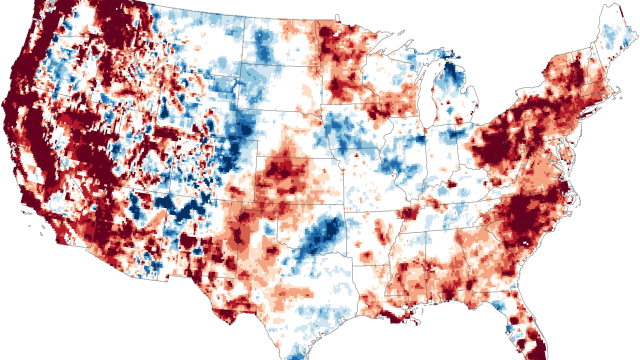
That’s according to NASA’s latest series of soil and groundwater moisture maps, which pull together data from the Gravity Recovery and Climate Experiment (GRACE) satellites, in addition to ground-based measurements. The maps show how water content in mid-September 2015 compares with averages for Septembers between 1948 and 2012, with warmer colours indicating drier-than-average conditions.
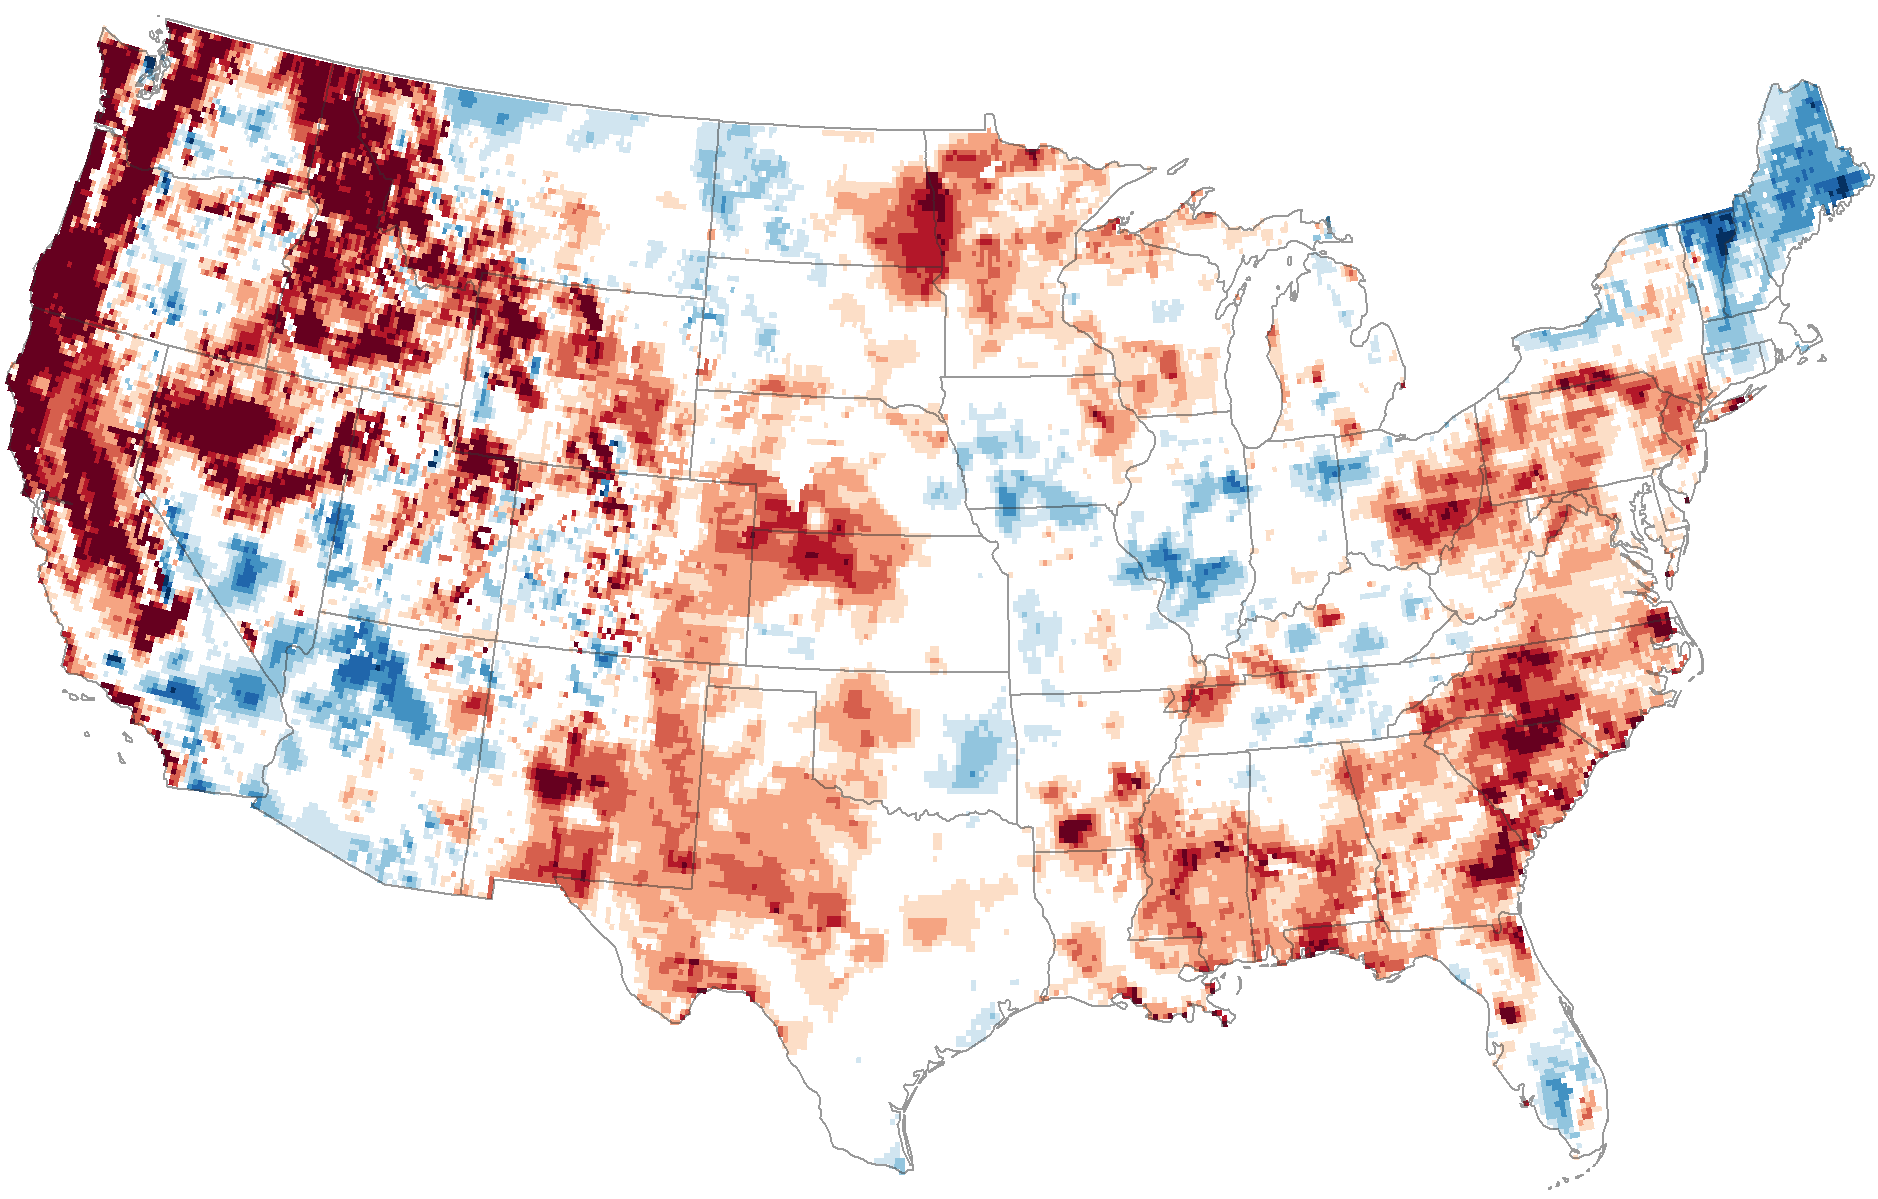
The first two maps look at the moisture content in the top two centimetres of the soil and the “root zone” — defined as the top metre of soil — respectively. These maps, which offer a reflection of recent conditions, highlight the abnormally dry conditions that gripped much of the Pacific Northwest during US summer. In case that wasn’t clear enough from the fact that we’ve seen numerous ground fires flare up across some of the wettest rainforests on the planet.
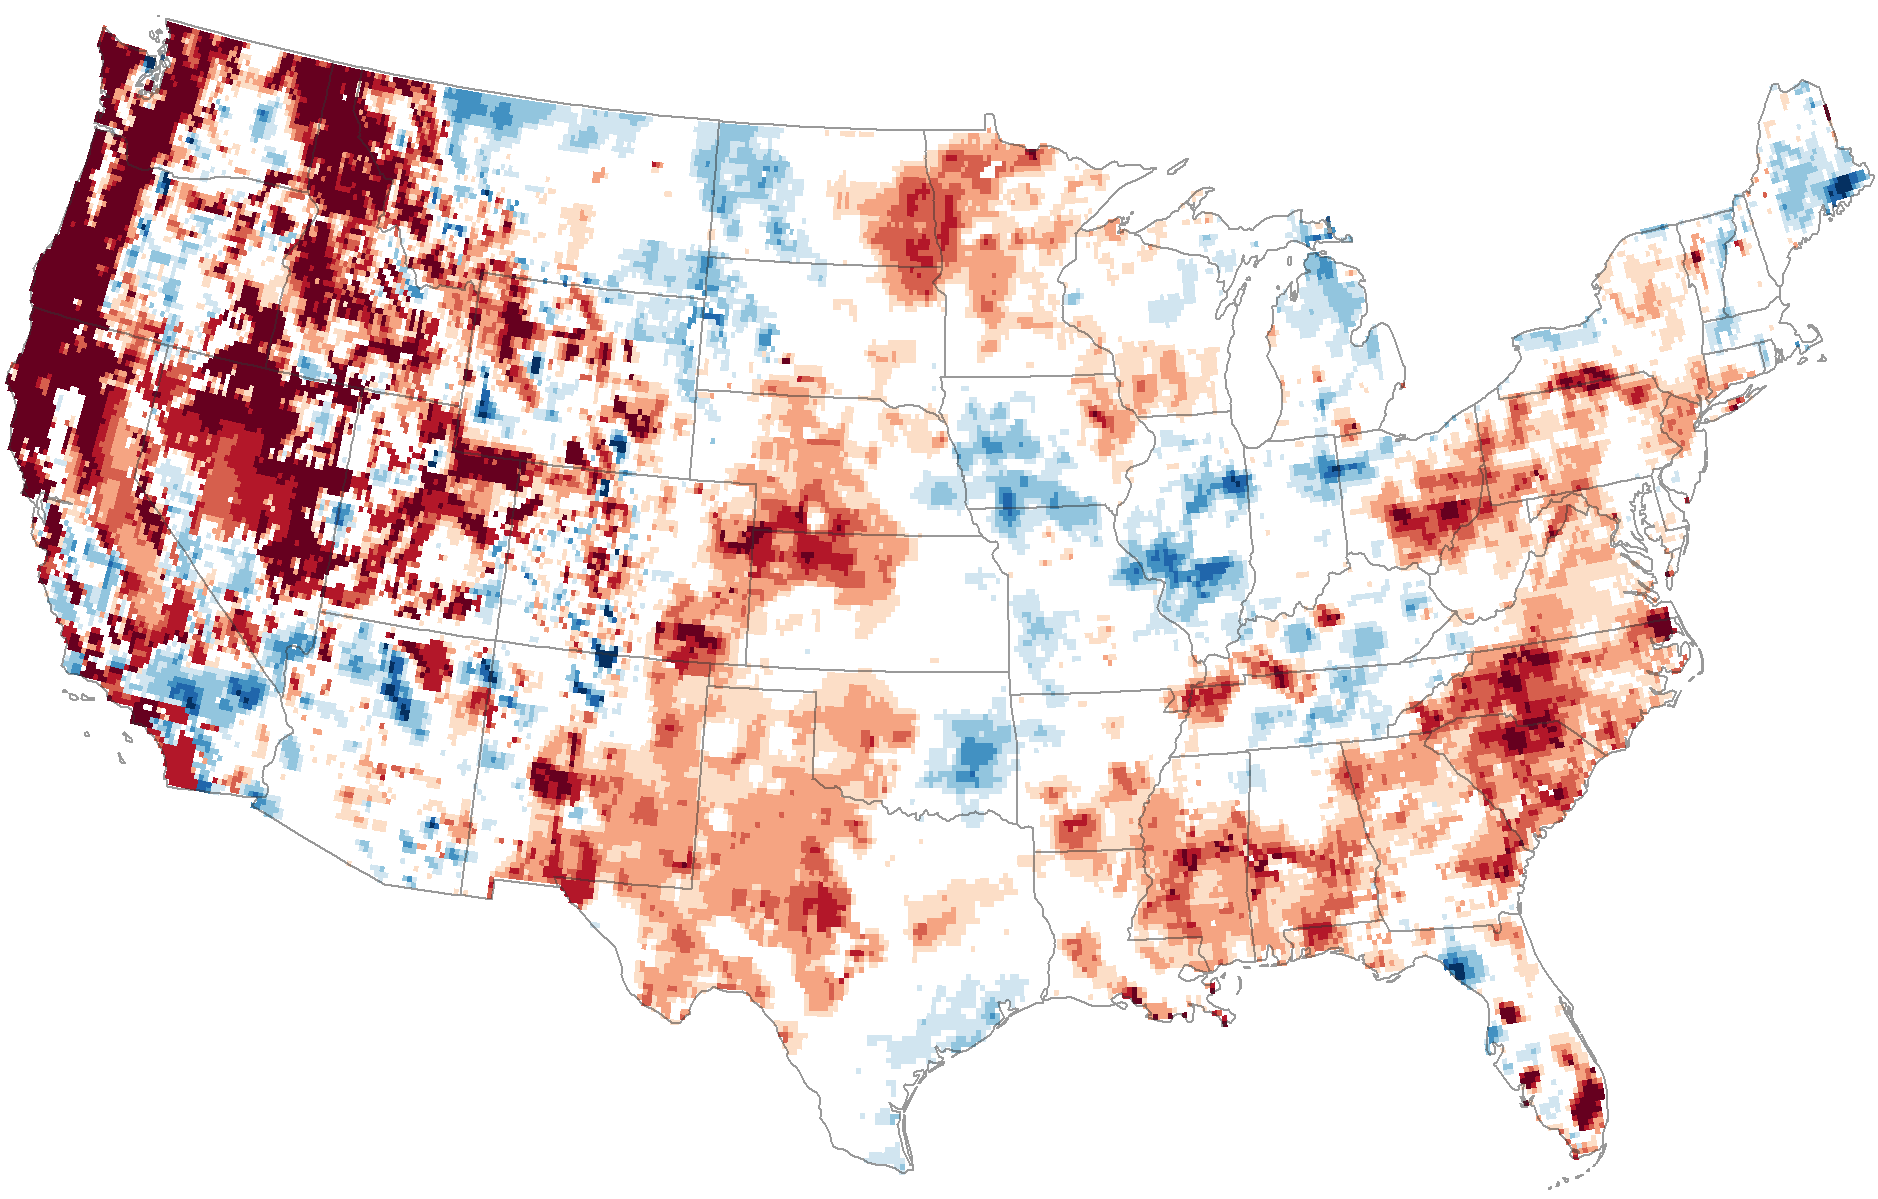
Meanwhile, a third map gives us the longer-term view, showing depleted ground water reservoirs across the entire western US and much of the East Coast. These trends aren’t all that surprising, either: They mirror another recent report which found that we’re draining major aquifers across the world faster than they’re being replenished.
It’s a small wonder that farmers out west are drilling as many wells as they can to extract the remaining ground water before it’s gone. Unfortunately, this “grab it while it’s still there” mentality is only escalating the problem. In the end, none of us get to beat water scarcity — we’re going to have to adjust.