How many months in a row have we run the same headline? Two? Three? Four? NOAA released its global climate report for August yesterday, and guess what? Once again, it’s the hottest month on record. With the year half over now, that makes 2015 a very, very strong contender for hottest year ever.
Here’s the now-familiar map of global surface temperatures for last month:
According to NOAA, here’s what you’re looking at:
The year-to-date temperature across global land and ocean surfaces was 1.51°F (0.84°C) above the 20th century average. This was the highest for January — August in the 1880 — 2015 record, surpassing the previous record set in 2010 by 0.18°F (0.10°C).
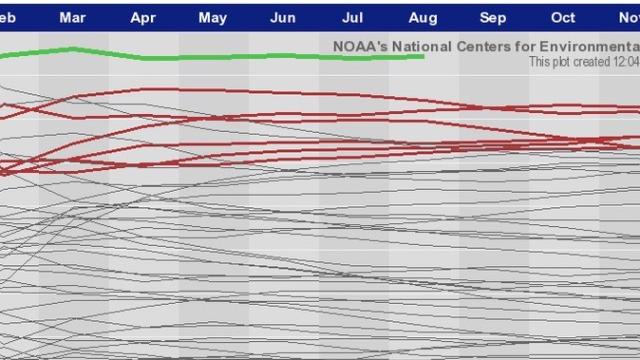
This chart which is made from NOAA data spells it out even better. The green line is 2015 so far. The red lines are the six warmest years in history: 2014, 2010, 2013, 2005, 2009, 1998.
Of all years since 1880, nothing really comes close to 2015 in terms of global temperature. pic.twitter.com/0ga54U392R
— Eric Holthaus (@EricHolthaus) September 17, 2015
If 2015 keeps up this exceptional streak that will mean that three of the warmest years on record will have happened in the five years. We did it!
Here are some more “highlights” from the report:
[NOAA]