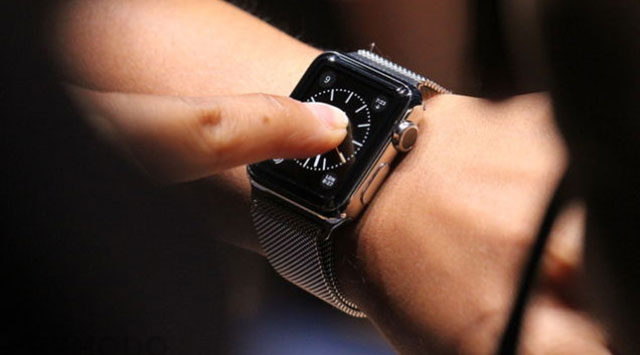
The world’s best — and most expensive — watches all have a sapphire crystal, because sapphire is incredibly hard, making them extremely scratch resistant and almost scratch-proof under normal use. But sapphire is expensive, so most watches instead have a glass crystal, which isn’t as hard or scratch resistant as sapphire, but still holds up.
But is there a visual difference between a watch that uses sapphire versus glass? If you were to hold up two identical watches side-by-side, the one with a glass crystal would be about 20% brighter than the one with sapphire (due to fundamental principles of optics that reduce its light transmission), so it appears somewhat darker and duller, particularly because the light has to pass through the crystal twice. There are some upcoming advanced technologies that can make significant improvements on this issue that we’ll mention below.
The above discussion is for traditional watches, which work by reflecting ambient light off the watch face that lies below the crystal. On the other hand, the visual consequences from using sapphire and glass are considerably greater when they are used on displays, including smartphones and smartwatches, because minimising screen reflections is especially important for displays, and sapphire has almost double (191%) the reflectance of glass.
Sapphire and Glass for Displays
Virtually all displays work by emitting image light rather than by reflecting ambient light like traditional watches. As a result, any ambient light that is reflected by the cover (glass or sapphire or anything else) washes out the display’s own image light, degrading picture quality, reducing its contrast and colour saturation, and making it harder to see the intended image. If you are watching a display in total darkness then the screen Reflectance doesn’t matter, but it has a surprisingly large effect on every display, even in subdued indoor ambient lighting, and it makes an enormous difference outdoors.
We’ll show below how large and how important the Reflectance effect is by comparing the display on an Apple Watch that has a Sapphire Crystal to an identical display on an Apple Watch Sport that has Ion-X Glass. The Apple Watch models are perfect for this comparison because they are identical except for their sapphire and glass covers. But they look and perform identically only in the dark…
Lowering Screen Reflectance
The standard way that has generally been used to improve display performance in ambient light is to fight fire-with-fire and just continue increasing the display’s Maximum Brightness. But there is a practical limit to that, plus a brighter display needs more power and a bigger battery. With some new advanced technologies that will be introduced soon, the Reflectance of both Sapphire and Glass will be reduced significantly.
We’ll show that the best (and smartest) way to improve display performance, image contrast, colour saturation, screen visibility and readability in ambient light is to lower the Screen Reflectance. Our test results and conclusions apply to all displays that are used in ambient lighting, including smartphones, smart watches, tablets, laptops, PC and video monitors, even TVs (if you watch during the day or with room lights on at night), and especially for displays that are mostly used in outdoor environments like digital signage and automobile displays.
Testing the Apple Watches
In this article we test and compare the display performance of an Apple Watch with a Sapphire Crystal to an Apple Watch Sport with Ion-X Glass. Although their internal OLED displays are identical, they have significant differences in optical performance due to the sapphire and glass covers. We’ll focus primarily on how differently they perform in ambient light with both Lab measurements and a side-by-side screen shot photo for a pure visual demonstration. We’ll cover all of the above issues and much more, with in-depth comprehensive display tests, measurements and analysis that you will find nowhere else.
The Display Shoot-Out
For in-depth testing and analysis of the OLED display on Apple Watch see our earlier Apple Watch OLED Display Technology Shoot-Out article. Also see our 2014 Smart Watch Display Shoot-Out article where we tested and compared the OLED display on the Samsung Gear 2 and the LCD display on the Sony SmartWatch 2. For this Display Shoot-Out article we are testing and comparing the Apple Watch with a Sapphire Crystal to an Apple Watch Sport with Ion-X Glass. To examine the display performance for the Apple Watches we ran our in-depth series of Mobile Display Technology Shoot-Out Lab tests and measurements in order to determine how the displays performed. We take display quality very seriously and provide in-depth objective analysis based on detailed laboratory tests and measurements and extensive viewing tests with both test patterns, test images and test photos. All the article results are from our DisplayMate High Ambient Light Display Test Lab, which can test displays at up to 80,000 lux with our proprietary instrumentation and test patterns.
Results Highlights
In this Results section we provide Highlights of the comprehensive DisplayMate Lab tests and measurements and extensive visual comparisons using test photos, test images, and test patterns that are covered in the advanced sections. The Display Shoot-Out Comparison Table summarises the Apple Watch and Apple Watch Sport Lab measurements in the following categories: Screen Reflections, Brightness and Contrast with Ambient Light, Colour Gamut with Ambient Light, Viewing Angle Variations. You can also skip these Highlights and go directly to the Apple Watch Sapphire vs Glass Conclusions.
Overview of the Apple Watch Displays
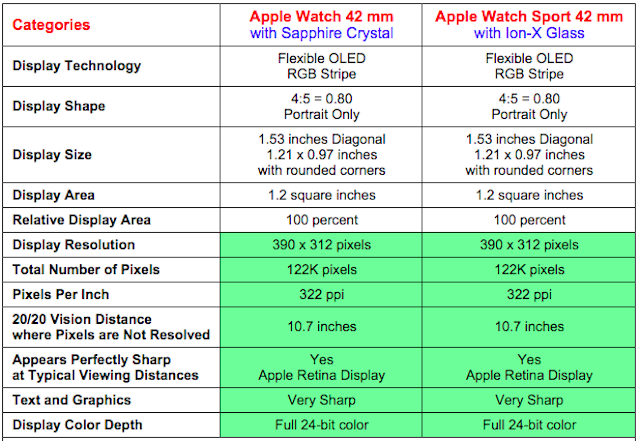
The Apple Watch comes in 3 models and two sizes — we tested the larger 42 mm Apple Watch model, which has a Sapphire crystal, and the 42mm Apple Watch Sport model, which has Ion-X Glass. Both models have an identical OLED display. See the Display Comparison Table for their detailed specs, and our earlier Apple Watch OLED Display Technology Shoot-Out article for an in-depth analysis of the OLED display.
Apple Watch Calibration
One very important and significant result from testing the two watch displays in the dark at 0 lux is that their photometry and colorimetry calibration measurements were both very good to excellent, and almost identical to one another, indicating a careful and accurate systematic factory calibration — Apple typically has each display individually calibrated. See the Brightness and Contrast and Colour Gamut sections andFigure 1 for measurements and details.
Screen Reflectance
In the dark both Apple Watch displays appear and perform identically, but in ambient light they appear and perform differently due to the difference in the Reflectance of Sapphire and Glass.
For the Apple Watch Sport with Ion-X Glass we measured the Screen Reflectance to be 4.7 per cent, while for the Apple Watch with Sapphire we measured 8.2 per cent Screen Reflectance, which is 74 per cent higher than with Glass. Both values are about 0.6 per cent higher than just pure sapphire and glass alone, indicating that Apple has done an excellent job in optically bonding both the glass and sapphire to the OLED display without an air gap. See the Reflections section for measurements and details.
Performance in Ambient Light
The 74 per cent higher Reflectance of the Apple Watch with Sapphire means that its screen will reflect almost twice as much surrounding ambient light as the Apple Watch Sport with Glass. And it takes surprisingly little ambient light for that to make a significant visible difference.
Contrast Decrease in Ambient Light
While the display Contrast Ratios are infinite at 0 lux absolute darkness, they decrease rapidly with ambient light. At just 500 lux, which is mid-range indoor ambient lighting, the display Contrast Ratios have fallen to just 29 with Glass and 17 with Sapphire. That is affected by the watch’s Light Sensor, which automatically dims the displays according to the current ambient light level. If we fool the Light Sensor and force the watches up to their Maximum Brightness of about 480 nits, the Contrast Ratios increase but are still only 64 with Glass and 38 with Sapphire at 500 lux. That’s indoors…
At an ambient light level of 2000 lux, which corresponds to moderate outdoor lighting in the shade or an overcast sky, the display Contrast Ratios are just 12 with Glass and 7 with Sapphire. When we fool the Light Sensor up to Maximum Brightness, the Contrast Ratios increase but are still only 17 with Glass and 10 with Sapphire at 2,000 lux. However, Full Daylight that is not in direct sunlight ranges from 10,000 to 25,000 lux — for 10,000 lux the Contrast Ratios are 3 and 2 respectively. See the Brightness and Contrast with Ambient Light section for measurements and details.
Colour Gamut Decrease in Ambient Light
While their Colour Gamuts are both close to 100% of the sRGB/Rec.709 Standard Gamut at 0 lux absolute darkness as shown in Figure 1, the display Colour Gamuts decrease with ambient light and are 82% with Glass and 69% with Sapphire at 500 lux, which is mid-range indoor ambient lighting. When we fool the Light Sensor up to Maximum Brightness the Colour Gamuts are 93% and 85% respectively, as shown in Figure 2. That’s indoors…
At an ambient light level of 2000 lux, which corresponds to moderate outdoor lighting in the shade or an overcast sky, the Colour Gamuts are just 58% with Glass and 39% with Sapphire. When we fool the Light Sensor up to Maximum Brightness, the Colour Gamuts are still only 68% with Glass and 54% with Sapphire at 2000 lux. However, Full Daylight that is not in direct sunlight ranges from 10,000 to 25,000 lux, and the Gamuts will continue to decrease significantly with increasing ambient light. See the Colour Gamut with Ambient Light section and Figure 2 for measurements and details.
Watch Viewing Angle Performance
For both the Sapphire and Glass displays we measured similar small to medium shifts in Brightness and Colour with Viewing Angles up through 30 degrees. At much larger Viewing Angles sapphire shows larger shifts than glass. See the Viewing Angle Variations section for details.
Analysing the Photo Below of the Watches in Ambient Light
The Lab tests quantitatively evaluate display performance with measurements of a large number of display parameters using specialised instruments and test patterns. Even if you like comparing Contrast Ratios, Colour Gamuts, and other parameters, it’s also nice to see a screen shot of the displays under test to visually compare the results and differences.
The Photo below is a side-by-side screen shot of the Apple Watch Sport with Ion-X Glass on the left, and the Apple Watch with Sapphire on the right. They were taken together simultaneously inside an Integrating Hemisphere that provides a very uniform light distribution coming from all directions. The watches are sitting on a dark black background.
Photo Caption with Explanations
There are a number of important but subtle details that we will explain first. The Apple Watch on the right has a mirror stainless steel finish, so the lower portion of the case appears dark in the photo because it is providing a mirror reflection of the black background. The Apple Watch Sport on the left has anodized aluminium with a matte finish that diffusely reflects light from all directions and therefore has a more uniform appearance. So if you don’t look closely it looks as if the Apple Watch on the right is smaller, but it’s just an optical illusion from the differing brightness reflections from the cases. Also note that the mirror finish of the watch on the right is reflecting the Digital Crown and Side Button of the watch on the left.
In the dark both watches appear identical. The OLED displays have a perfect all black background, with white text and graphics, and a vibrant saturated red second hand.
The screen shot Photo below was taken at an ambient light level of 2,000 lux, which corresponds to moderate outdoor lighting in the shade or an overcast sky. Indoor residential lighting typically ranges from 100 to 500 lux, while office, commercial, and task lighting typically ranges 500 to 1,500 lux. Full Daylight that is not in direct sunlight ranges from 10,000 to 25,000 lux, while direct sunlight is 120,000 lux. To see how other displays perform in up to 40,000 lux see this article on Displays in High Ambient Light.
In the Photo below the ambient light penetrates and reflects from different layers in the display so some of its internal structures are visible. The OLED display itself is the inner rectangle in both watches. The background is much brighter on the right Sapphire display due to its 74% higher Reflectance compared to the Glass display on the left. The reflected ambient light reduces the image contrast of the white text and graphics, and also the colour saturation and vibrancy of the red second hand. The large differences between displays are very obvious and striking.
Finally, on a technical note, the slight green tint visible in the photo for the Apple Watch with Sapphire on the right is due to a variation in its Reflectance Spectrum for ambient light, which is stronger in the green portion of the spectrum and weaker in the red and blue portions of the spectrum compared to the Apple Watch Sport with Glass display on the left. It is unlikely to be noticeable except possibly in high ambient light that is itself neutral in colour. This effect does not occur with pure sapphire, so it is most likely due to something in the optical bonding and lamination of the sapphire to the OLED display.
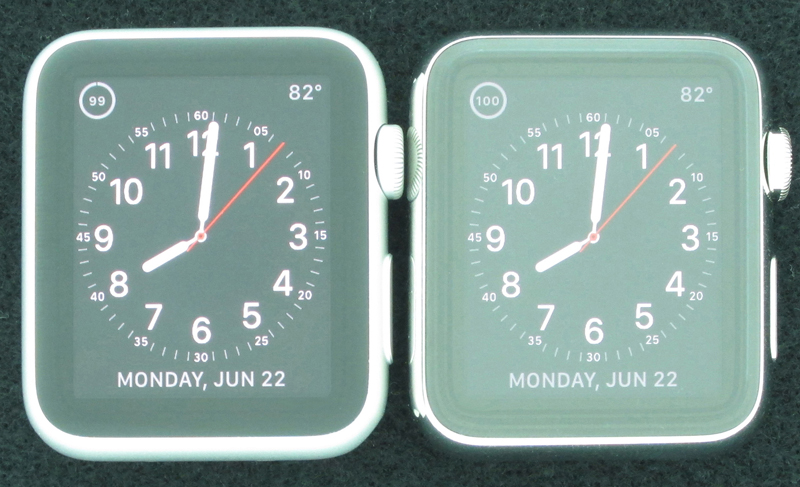
Photo of the Apple Watches in 2,000 lux Uniform Ambient Light. On left: Apple Watch Sport with Glass. Right: Apple with Sapphire.
Apple Watch Sapphire vs Glass Display Conclusions
The primary goal of this Display Technology Shoot-Out article series has always been to publicise and promote display excellence so that consumers, journalists and even manufacturers are aware of and appreciate the very best in displays and display technology. We point out which manufactures and display technologies are leading and advancing the state-of-the-art for displays by performing comprehensive and objective scientific Lab tests and measurements together with in-depth analysis. We point out who is leading, who is behind, who is improving, and sometimes (unfortunately) who is back pedalling… all based solely on the extensive objective careful Lab measurements that we also publish, so that everyone can judge the data for themselves as well… See the Display Shoot-Out Comparison Table for all of the Lab measurements and testing details, and the Results Highlights section above for a more general overview with explanations.
Apple Watch OLED Display
The Apple Watches have an excellent state-of-the-art OLED display that we analysed in detail in our earlier Apple Watch OLED Display Technology Shoot-Out article. Refer to that article for an in-depth analysis of their OLED display.
Apple Watch and Apple Watch Sport Displays
For this article we have compared and analysed the displays on the Apple Watch with a Sapphire Crystal and the Apple Watch Sport with Ion-X Glass. Both watches have the same OLED display, only the cover sapphire and glass are different, resulting in a large difference in their Screen Reflectance and performance in ambient light. One very important and significant result from testing the two watch displays in the dark at 0 lux is that their photometry and colorimetry calibration measurements were both very good to excellent, and almost identical to one another, indicating a careful and accurate systematic factory calibration — Apple typically has each display individually calibrated. See the Brightness and Contrastand Colour Gamut sections and Figure 1 for measurements and details.
Different Screen Reflectance
In the dark both Apple Watch displays appear and perform identically, but in ambient light they appear and perform differently due to the difference in the Reflectance of Sapphire and Glass.
For the Apple Watch Sport with Ion-X Glass we measured the Screen Reflectance to be 4.7 per cent, while for the Apple Watch with Sapphire we measured 8.2 per cent Screen Reflectance, which is 74 per cent higher than Glass. Both values are about 0.6 per cent higher than just pure sapphire and glass alone, indicating that Apple has done an excellent job in optically bonding both the glass and sapphire to the OLED display without an air gap. See the Reflections section for measurements and details.
Both sapphire and glass each have many distinctive and important properties besides the Reflectance, and what is particularly interesting and relevant is that by using some new advanced technologies, the Reflectance of not only Sapphire but also Glass will be reduced significantly in the very near future for some displays, with major implications and improvements for both the visual and optical display performance, which we will discuss below.
Different Performance in Ambient Light
The 74 per cent higher Reflectance of the Apple Watch with Sapphire means that its screen will reflect almost twice as much surrounding ambient light as the Apple Watch Sport with Glass. And it takes surprisingly little ambient light for that to make a visible difference.
Contrast Ratio
While their Contrast Ratios are infinite at 0 lux absolute darkness, they decrease rapidly with ambient light. At just 500 lux, which is mid-range indoor ambient lighting, the display Contrast Ratios have fallen to just 64 with Glass and 38 with Sapphire (with the displays set to their Maximum Brightness of about 480 nits by fooling the Ambient Light Sensor, otherwise it is less than half the values). That’s indoors…
At an ambient light level of 2000 lux, which corresponds to moderate outdoor lighting in the shade or an overcast sky, the display Contrast Ratios are just 17 with Glass and 10 with Sapphire (again with the displays set to their Maximum Brightness by fooling the Ambient Light Sensor, otherwise it is about 70% of the values). However, Full Daylight that is not in direct sunlight ranges from 10,000 to 25,000 lux — for 10,000 lux the Contrast Ratios are 3 and 2 respectively. See the Brightness and Contrast with Ambient Light section for measurements and details.
Colour Gamut and Colour Saturation
While their Colour Gamuts are both close to 100% of the sRGB/Rec.709 Standard Gamut at 0 lux absolute darkness as shown in Figure 1, they also decrease with ambient light. At just 500 lux, the Colour Gamut is 93% with Glass and 85% with Sapphire (with the displays set to their Maximum Brightness of about 480 nits by fooling the Ambient Light Sensor, otherwise it is about 15% less), as shown in Figure 2. That’s indoors…
At an ambient light level of 2,000 lux, which corresponds to moderate outdoor lighting in the shade or an overcast sky, the Colour Gamuts are just 68% with Glass and 54% with Sapphire (again with the displays set to their Maximum Brightness by fooling the Ambient Light Sensor, otherwise it is about 80% of the values). See the Colour Gamut with Ambient Light section and Figure 2 for measurements and details.
Photo of the Displays in Ambient Light
The Lab measurements like the Contrast Ratios and Colour Gamuts above quantitatively evaluate display performance, but it’s also nice to see a screen shot of the displays under test to visually compare the results and differences. The Photo Above or this Photo Link is a side-by-side screen shot of the Apple Watch Sport with Ion-X Glass on the left, and the Apple Watch with Sapphire on the right. They were taken together simultaneously inside an Integrating Hemisphere that provides a very uniform light distribution coming from all directions at an ambient light level of 2,000 lux, which corresponds to moderate outdoor lighting in the shade or an overcast sky. See the Caption or the Photo Link for a detailed explanation of the photo.
Lowering the Reflectance of Sapphire and Glass
The standard way that has generally been used to improve display performance in ambient light is to fight fire-with-fire and just continue increasing the display’s Maximum Brightness. But there is a practical limit to that, plus a brighter display needs more power and a bigger battery. Clearly the best (and smartest) way to improve display performance, image contrast, colour saturation, screen visibility and readability in ambient light is to lower the Screen Reflectance. In fact, it is the only way to turn the marginal Yellow Contrast and Gamut measurement results in theDisplay Shoot-Out Comparison Table into Green Very Good to Excellent performance levels. Plus, if you do that, the same display can be used at a lower Brightness setting, which will decrease the display power and increase the running time on battery.
In order to increase the use of sapphire for displays, the sapphire industry will need to modify the optical properties of sapphire without significantly affecting its scratch resistance and other mechanical properties. It can’t be done using traditional Anti-Reflection optical coatings which scratch easily.
With some new advanced technologies that will be introduced soon, the Reflectance of not only Sapphire but also Glass will be reduced significantly for some displays, and they will be available in the very near future, with major implications and improvements for both visual and optical display performance.
We will provide more information on Low Reflectance Sapphire and Glass in our upcoming 2015 Innovative Displays and Display Technologiesarticle. Here is a link to the 2014 Edition. Follow DisplayMate on Twitter to learn about these developments and our upcoming display technology coverage.
The Next Steps in Display Performance Improvements in Ambient Light
Lowering the Screen Reflectance is just the first step in the upcoming major improvements of display performance in ambient light. The next steps will include using very wide Colour Gamuts together with Dynamic Colour Management and a Dynamic Intensity Scale that are both automatically adjusted real-time based on the measured current Ambient Light level in order to have them compensate for the reflected light glare and image wash out from ambient light as discussed above and in our 2014 Innovative Displays and Display Technology article.
All of these results and conclusions apply to all displays that are used in ambient light, including smartphones, smart watches, tablets, laptops, PC and video monitors, even TVs (if you watch during the day or with room lights on at night), and especially for displays that are mostly used in outdoor environments like digital signage and automobile displays.
The displays, technologies, and manufacturers that succeed in implementing these new high ambient light display performance strategies will take the lead in the next generations of displays… Follow DisplayMate on Twitter to learn about these developments and our upcoming display technology coverage.
Display Shoot-Out Comparison Table
Below we examine in-depth the relative display performance of the Apple Watch that has a Sapphire Crystal with the display on the Apple Watch Sport that has an Ion-X Cover Glass, using objective Lab measurement data and criteria.
The displays on both Apple Watches have the same OLED display with identical specifications except for the outer display cover, which is either Sapphire or Ion-X Glass and results in significant differences in optical performance that are analysed below. For an in-depth analysis of the OLED display on Apple Watch display see our earlier Apple Watch OLED Display Technology Shoot-Out article.
Below is a partial excerpt of the table; you can view the complete Data Comparison Table here.
This article has been republished with permission fromDisplayMate.com, where it can be read in its entirety.
About the Author
Dr. Raymond Soneira is President of DisplayMate Technologies Corporation of Amherst, New Hampshire, which produces display calibration, evaluation, and diagnostic products for consumers, technicians, and manufacturers. See www.displaymate.com. He is a research scientist with a career that spans physics, computer science, and television system design. Dr. Soneira obtained his Ph.D. in Theoretical Physics from Princeton University, spent 5 years as a Long-Term Member of the world famous Institute for Advanced Study in Princeton, another 5 years as a Principal Investigator in the Computer Systems Research Laboratory at AT&T Bell Laboratories, and has also designed, tested, and installed colour television broadcast equipment for the CBS Television Network Engineering and Development Department. He has authored over 35 research articles in scientific journals in physics and computer science, including Scientific American. If you have any comments or questions about the article, you can contact him at dtso.info@displaymate.com.
DisplayMate Display Optimization Technology
All displays can be significantly improved using DisplayMate’s proprietary very advanced scientific analysis and mathematical display modelling and optimization of the display hardware, factory calibration, and driver parameters. We help manufacturers with expert display procurement, prototype development, testing displays to meet contract specifications, and production quality control so that they don’t make mistakes similar to those that are exposed in our public Display Technology Shoot-Out series for consumers. This article is a lite version of our advanced scientific analysis — before the benefits of our DisplayMate Display Optimization Technology, which can correct or improve all of these issues. If you are a display or product manufacturer and want to significantly improve display performance for a competitive advantage then Contact DisplayMate Technologies.
About DisplayMate Technologies
DisplayMate Technologies specialises in proprietary advanced scientific display calibration and mathematical display optimization to deliver unsurpassed objective performance, picture quality and accuracy for all types of displays including video and computer monitors, projectors, HDTVs, mobile displays such as smartphones, smart watches, and tablets, and all display technologies including LCD, OLED, 3D, LED, LCoS, Plasma, DLP and CRT. This article is a lite version of our intensive scientific analysis of mobile displays — before the benefits of our advanced mathematical DisplayMate Display Optimization Technology, which can correct or improve many of the display deficiencies. We offer DisplayMate display calibration software for consumers and advanced DisplayMate display diagnostic and calibration software for technicians and test labs.
For manufacturers we offer Consulting Services that include advanced Lab testing and evaluations, confidential Shoot-Outs with competing products, calibration and optimization for displays, cameras and their User Interface, plus on-site and factory visits. We help manufacturers with expert display procurement, prototype development, and production quality control so they don’t make mistakes similar to those that are exposed in our Display Technology Shoot-Out series. See our world renown Display Technology Shoot-Out public article series for an introduction and preview. DisplayMate’s advanced scientific optimizations can make lower cost panels look as good or better than more expensive higher performance displays. If you are a display or product manufacturer and want to turn your display into a spectacular one to surpass your competition then Contact DisplayMate Technologies to learn more.