Saturday’s earthquake in Nepal has killed more than 5500 people and injured at least 11,000. Now, we’re seeing how the disaster appears from space, with both NASA and the European Space Agency releasing satellite imagery of the event.
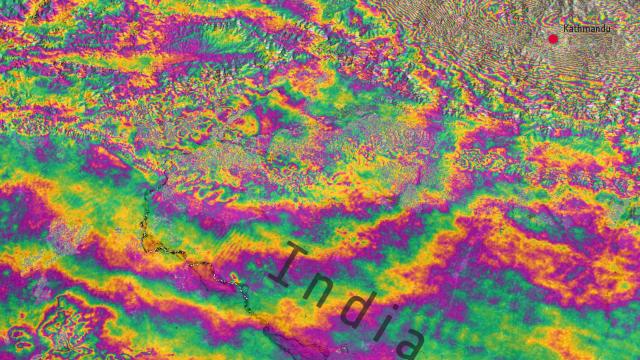
Above is an image combining radar imagery from April 17 and April 29, acquired by the ESA’s Sentinel-1A satellite. Known as an interferogram, it shows the difference between land height following the earthquake (which occurred on April 25) to an accuracy of inches. According to the ESA around 12,000 square kilometres of land has moved — half up and half, including the region north of Kathmandu, down.
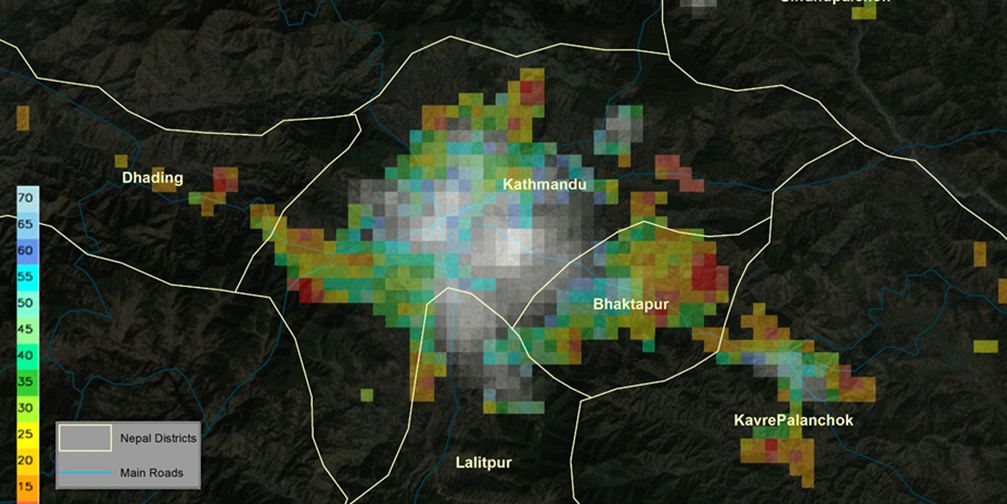
Below is NASA’s map of visible might emitted across the city of Khatmandu, created by its Short-term Prediction Research and Transition (SPoRT) project. By monitoring changes in visible light across the city overnight it’s possible to identify which areas are most badly affected by damage to electrical infrastructure and then target resources accordingly. On the image, warmer colours like orange and red show the biggest reduction in emitted light. These patches seem to correspond to the suburban areas around Kathmandu.
Images like these will help rescue workers to work more effectively on the ground, as well as providing a means for scientists to understand the ‘quake and future events in more detail. [ESA, NASA]