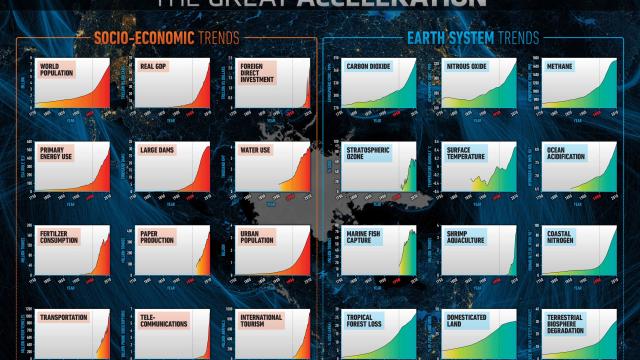
Using 24 key social, economic, and environmental indicators, our friend Félix Pharand-Deschênes has created a dashboard that shows how human pressure on planet Earth is reaching critical level. Fast. The acceleration shown over the last 60 years is absolutely crazy. Zoom in. Freak out.
Just look at those curves — some of them exponential. World population and economic growth affecting energy, food, and water use that demand an increase in gas and oil production, fertiliser consumption to boost food production, and dam construction. At the same time, on the right, observe the dramatic increase on carbon dioxide, nitrous oxide, methane, stratospheric ozone, coastal nitrogen, acidification of oceans, marine fish captures or tropical forest loss levels.
The data comes from a new study on planetary boundaries — the limits of global factors that scientists believe would be dangerous for humanity’s survival. The study results suggest that we have crossed the line on “climate change, biosphere integrity, land-system change, and altered biogeochemical cycles (fertiliser use, phosphorus and nitrogen.)” And while “some improvements are visible, for example the recent apparent stabilisation of the ozone hole, many indicators are now beyond natural variability and remain on unsustainable trajectory.”
The Great Acceleration
Is it reasonable to establish a connection between socio-economic trends and Earth system trends? Scientists believe there is enough evidence to suggests just that. You only have to observe the vertical line dividing those graphics. The rapid acceleration starts in 1950.
According to Professor Will Steffen — from the Stockholm Resilience Centre, Stockholm University and Australian National University, Canberra — they “expected to see major changes but what surprised [them] was the timing. The most dramatic shifts have occurred since 1950. We can say that around 1950 was the start of the Great Acceleration.”
It seems that nothing is going to change anytime soon. And while some conspiracy theorists will denounce these indicators as some kind of judeo-masonic-communist conspiracy to destroy capitalistic economies, the scientific data is stubborn — and unaffected by political debate. It shows that things are changing and reaching critical points at increasing speeds. There is now a very real possibility that we may end up destroying ourselves and a lot of species and ecosystems — we have already done the latter many times and in many places.
This is not about defending Earth. It’s all about defending ourselves. We are the only ones losing here. Like Professor Katherine Richardson, from the Center for Macroecology, Evolution and Climate of the University of Copenhagen says: “Earth is familiar with large environmental changes, but modern human society is not.”
Like in the many extinctions that preceded our rise as the dominant species on this pale blue dot, Earth will just readjust and carry on.
Check out this slideshow for a more detailed look on the data
Great Acceleration 2015 from International Geosphere-Biosphere Programme