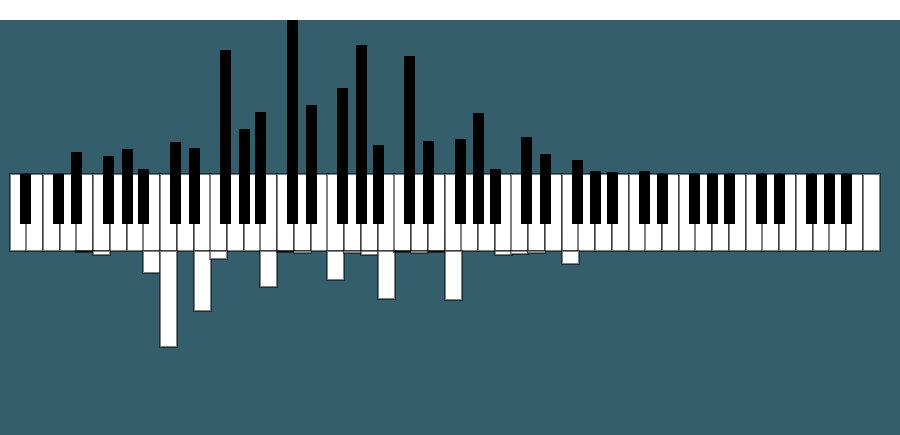
Ever wondered how many times a certain note gets played during the course of a song? Well, this tool developed by Joey Cloud lets you visualise the number of times each note is played on a histogram — that happens to look exactly like the piano keyboard it represents.
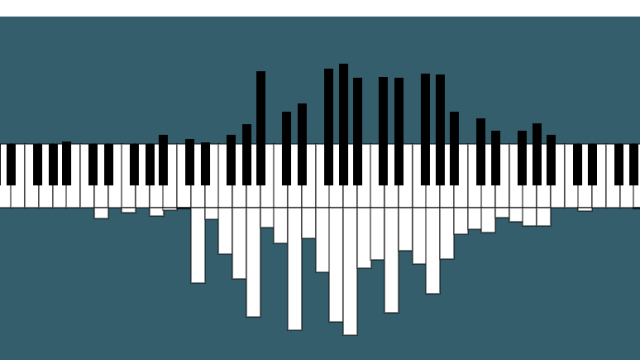
The simple visualisation shows the frequency with which each note of the keyboard is played during a piece of music. The image above shows Rimsky-Korsakov’s Flight of the Bumblebee; the one below is Chopsticks. Notice the subtle and nuanced differences?
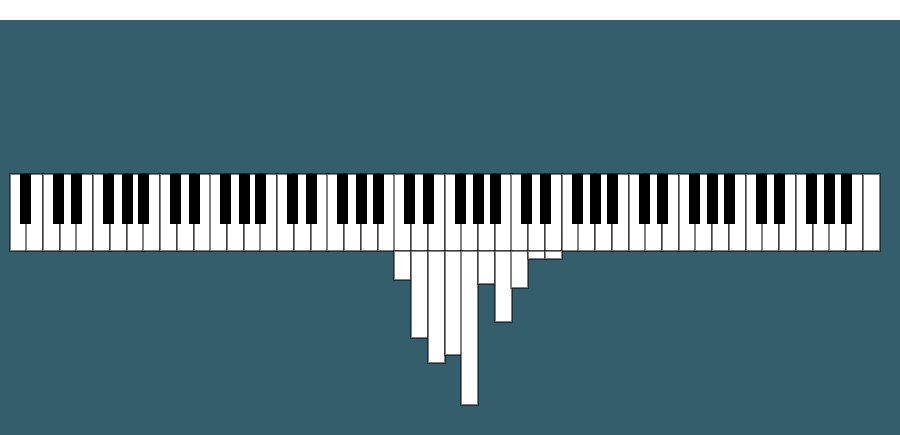
The neat thing is that you can also upload your own MIDI files to the Pianogram site and see what any song looks like. That’s why the one right at the bottom shows you what Sweet Child o’Mine looks like. [Joey Cloud via Flowing Data]