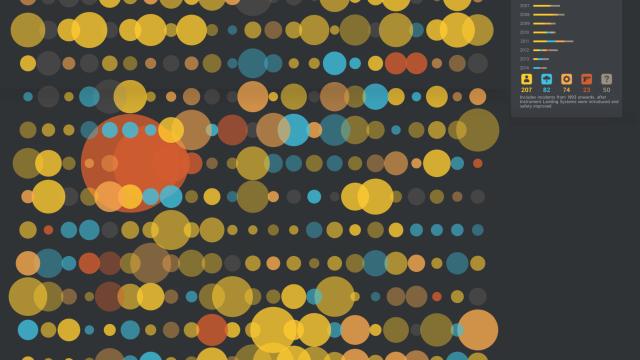
Fascinating interactive data visualisation by Information Is Beautiful Studio for BBC Future: All the flight incidents from 2014 to 1993 in one single graphic — 436 in total. The size of the circles correspond to the number of fatalities. Particularly interesting is the chart on the top right.
It clearly shows that air travel has gotten much safer since 1993, with the gradual introduction of ILS (Instrument Landing System) guidance and improved security standards and protocols. Make sure to play with the interactive version here. It allows to see details of every crash, as well as filtering by crash causes and flight stages.