If you’ve ever wondered where the true home of sasquatch might be, then this visualisation of sightings could help you track the mythical beast down.
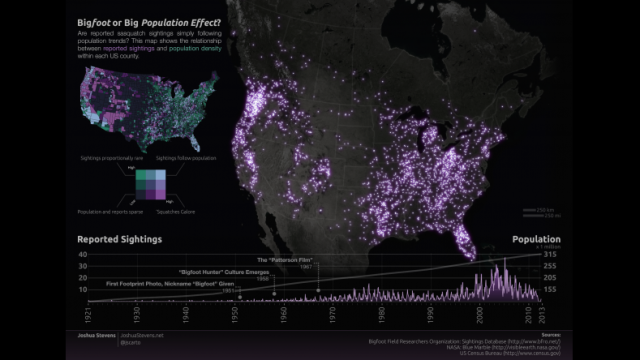
Put together by Josh Stevens, a PhD candidate at Penn State, this visualisation shows 92 years of sasquatch sightings, and is based on data from the Bigfoot Field Researchers Organisation. If you look at the map and suspect that sightings mirror population density — a fair assumption — then Stevens is one step ahead of you:
Right away you can see that sightings are not evenly distributed. At first glance, it looks a lot like a map of population distribution. After all, you would expect sightings to be the most frequent in areas where there are a lot of people. But a bivariate view of the data shows a very different story. There are distinct regions where sightings are incredibly common, despite a very sparse population. On the other hand, in some of the most densely populated areas sasquatch sightings are exceedingly rare.
The second, bivariate map is the one on the left, where bright purple shows high sasquatch sightings/low population density, and light green points to high population density/low sassquatch sightings. So it’s not driven by population density — but it might be driven by the vegetation, terrain and, umm, enthusiasm for sasquatch sightings in those areas instead. [Josh Stevens via Flowing Data]