Using an expert computer system to parse through over three million satellite photos, scientists have compiled a high resolution map of the Earth that’s offering an unprecedented glimpse into how our planet’s surface water has changed over the past three decades.
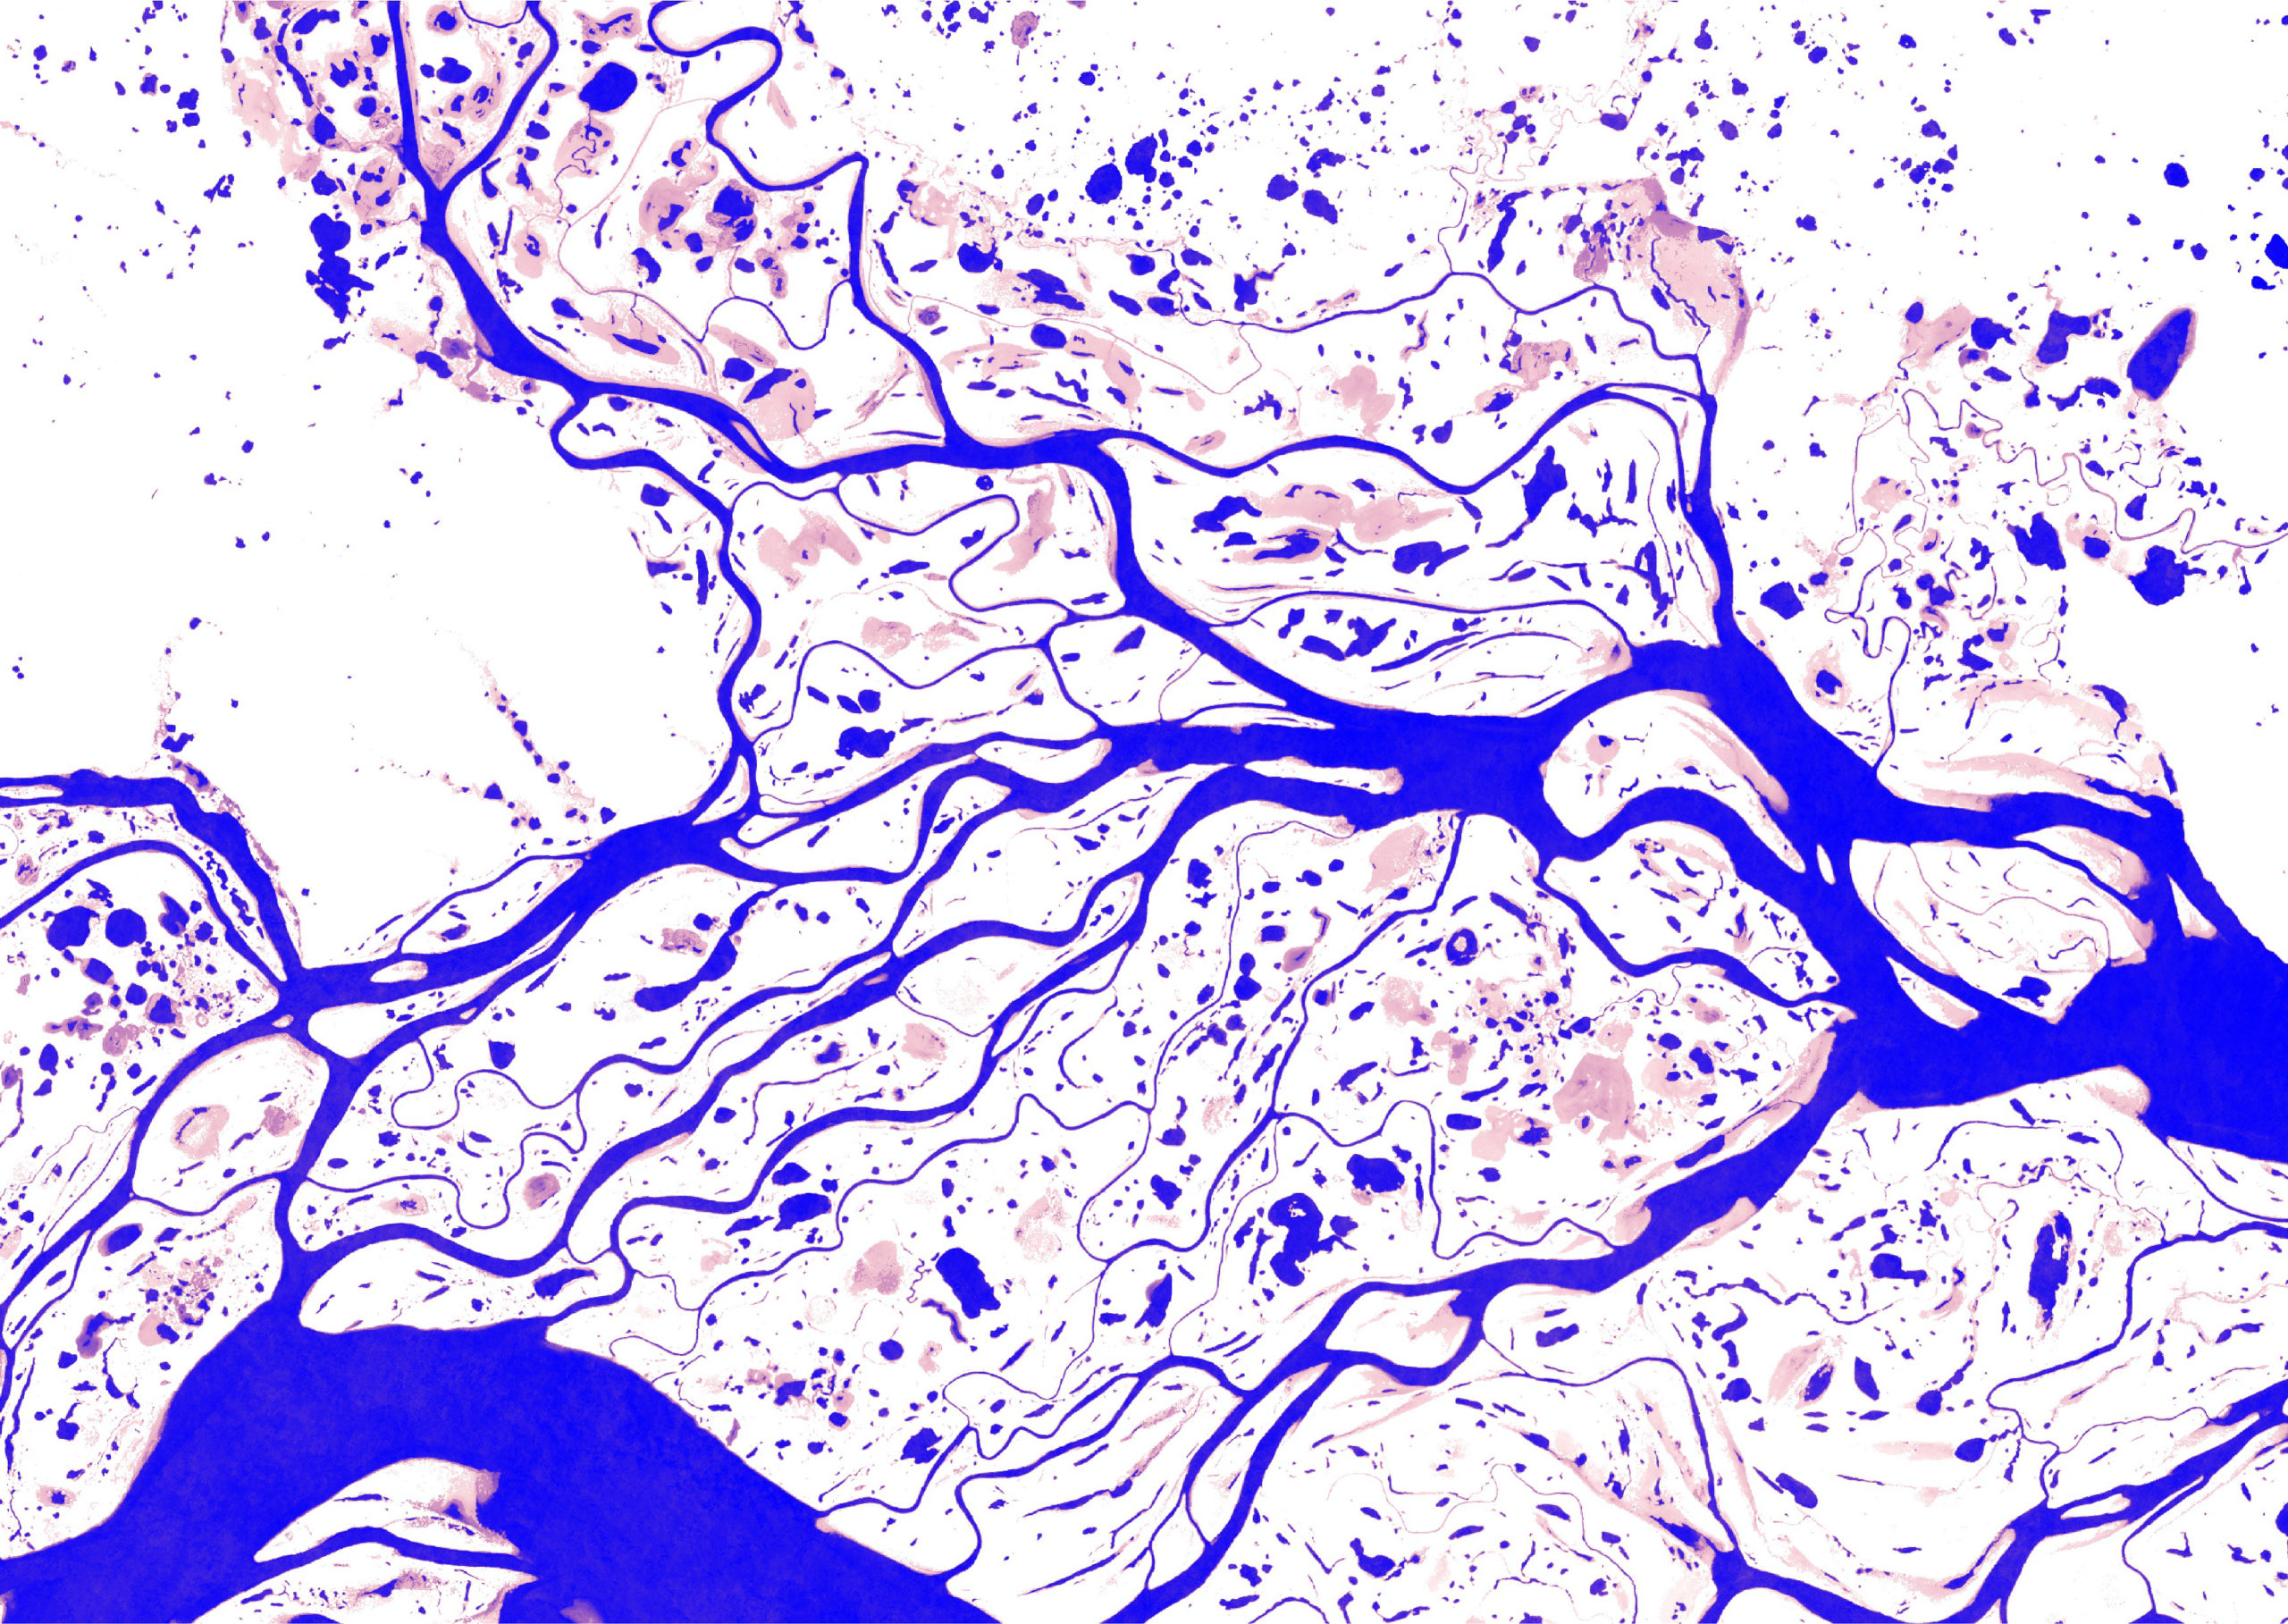
A map showing the distribution and change in surface water over a 32-year period. This particular map shows the River Ob in Siberia, where dark blue colours are areas of permanent water, lighter blue colours are areas of seasonal water, green colours represent new areas of seasonal water, and pink colours represent areas of lost seasonal water. (Image: © EC-Joint Research Centre / Google, 2016)
This new mapping effort was led by Jean-François Pekel from the European Commission’s Joint Research Centre in Ispra, Italy. Recorded at a resolution of 30m x 30m, the new maps show the planet’s water surfaces (excluding oceans) in astonishing detail. What’s more, it tracks changes in features like rivers, lakes and wetlands over the course of 30 years. Using these maps, scientists can now study how surface waters are changing over time, and how human activities are reshaping the planet.
Earlier attempts to map our planet’s surface waters lacked the required resolution. They were too fuzzy to discern smaller lakes and rivers — a huge limitation given that millions of lakes less than one square km in size account for roughly 40 per cent of the global area of inland water. Previous satellite surveys, the best of which featured a resolution of 250m x 250m, made it difficult for geologists to discern surface water from ground; the colour of water varies greatly depending on depth, presence of sediments and dissolved chemicals and the angle at which the sunlight hits the surface.
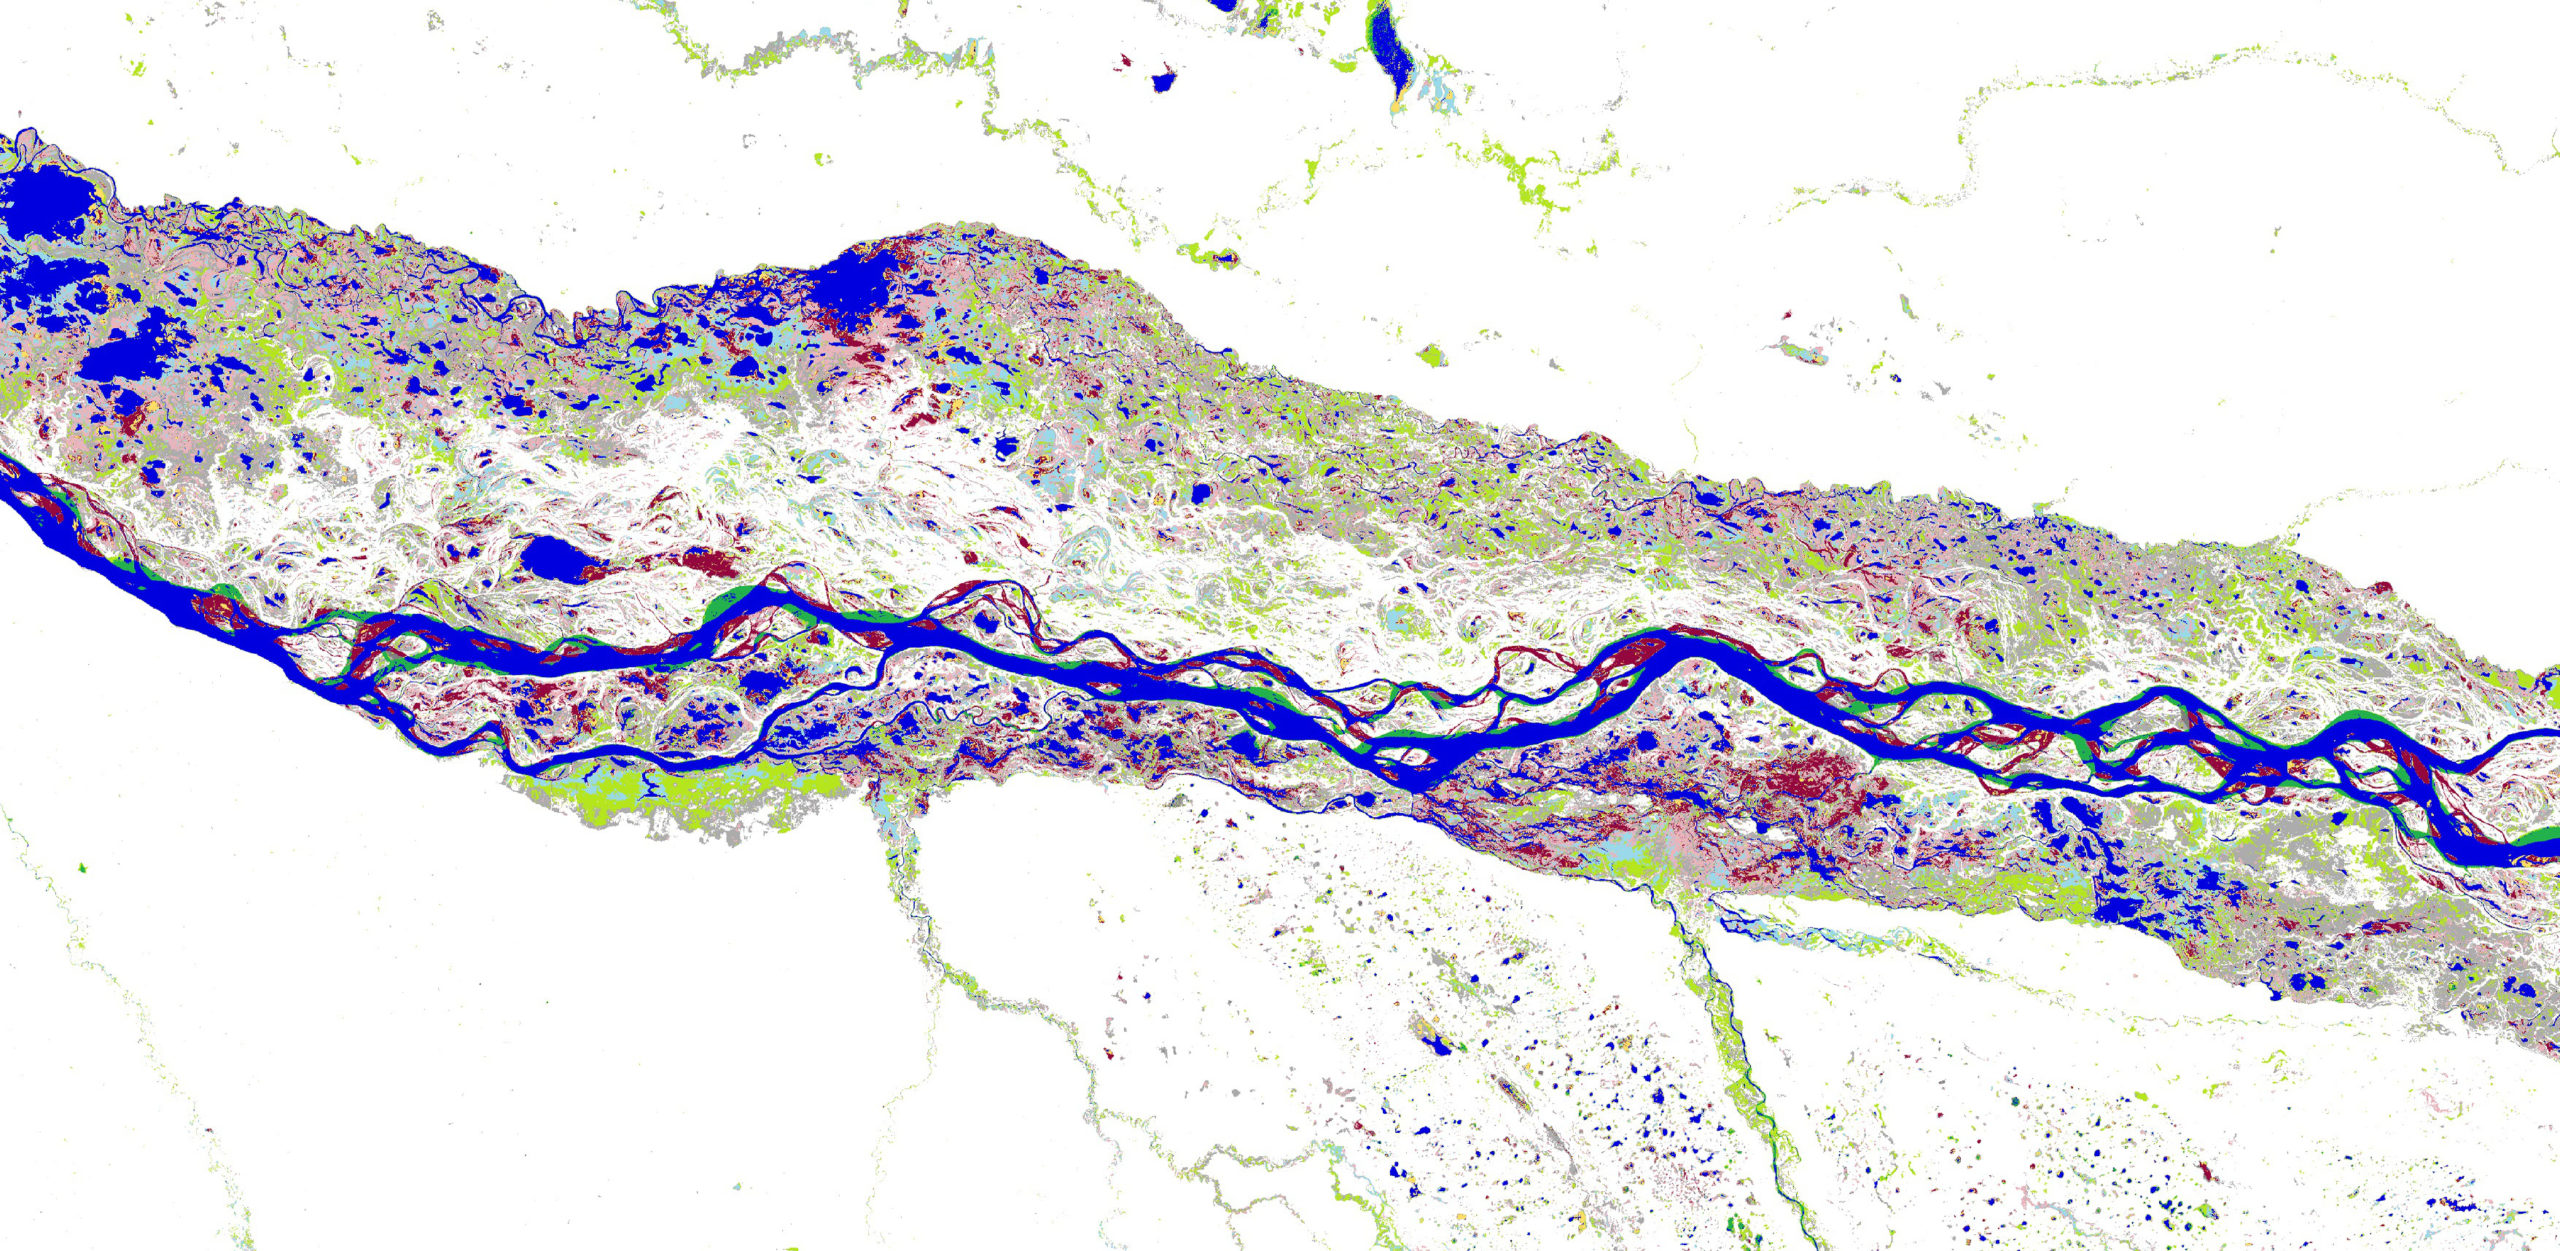
This map of the Paraná River in North-Eastern Argentina and shows how rivers meander and move, how floodplains flood intermittently, and how new areas of permanent and seasonal water are being created and lost through time. (Image: © EC-Joint Research Centre / Google, 2016)
For the new survey, Pekel’s team sought to create a truly global and methodologically consistent measurement of changes in surface water over time. Indeed, our planet’s water surfaces are constantly shifting, owing to natural process like flooding, sedimentation and channel migration, and due to human activities like the construction of dams, reservoirs and water extraction.
To say this was a meticulous survey would be a gross understatement. The researchers analysed 3,066,102 Landsat images taken at monthly intervals between 1984 and 2015. To handle all this data — 1.8 terabytes to be exact — and to distinguish terrestrial land features from water, the researchers utilised an expert computer system and the processing power of the Google Earth Engine platform.
Using this system, the researchers were able to classify each pixel (representing a 30m x 30m block) of each image as being either water, land or a non-valid observation. The resulting 32-year record of our planet’s water history was then used to produce a set of sortable maps that document different facets of surface water dynamics.
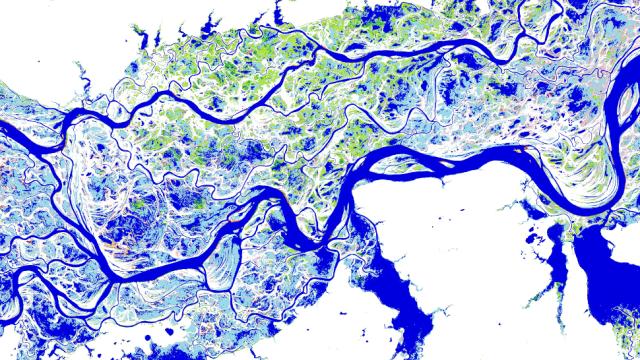
This map shows the upper stretches of the Yenisei River in Russia and captures the spatial and temporal patterns in surface water. Dark blue colours are areas of permanent water and the pink colours show areas of where water occurs less often. (Image: © EC-Joint Research Centre / Google, 2016)
These maps have revealed some fascinating changes over a relatively short period of time. Collectively, permanent surface water has disappeared from an area measuring almost 90,000 square km since 1984 — roughly equivalent to Lake Superior. Around 70 per cent of surface water losses occurred in just five Middle Eastern countries: Kazakhstan, Uzbekistan, Iran, Iraq and Afghanistan. This illustrates the tremendous water management challenges in this region, including drought.
Over the same time period, new permanent surface water features formed elsewhere, covering an area about double that from which water was lost, or 184,000 square km. Most new water features were associated with reservoir construction, but the impact of climate change was also detected.
“In some places, like the Tibetan plateau… a cause and effect relationship with climate can be unambiguously established,” Pekel told Gizmodo. “Basically, the observed expansion of the [closed] lakes of the Tibetan Plateau, is a consequence of the accelerated snow-and-glacier melt caused by rising temperatures and increased rainfall.”
In total, the new data shows that our planet, as of 2011, is covered with 2.78 square km of permanent surface water, and 0.81 million square km of seasonal surface water. Armed with these maps, geologists and climate scientists will be better equipped to assess the impacts of global warming, while also capturing the effects of human activity on surface water resource distribution.
[Nature]