Thanks to a super-sensitive new tool, NASA can now see exactly where air pollution is increasing and decreasing — down to the level of neighbourhoods — and in some cases, the results are surprising.
In 2004, NASA launched its Aura satellite, a research craft designed to monitor the Earth’s ozone. One of the (many!) instruments aboard Aura was the OMI, or Ozone Monitoring Instrument, which has been sending back information about nitrogen dioxide, or the gas that billows out of our cars, factories, and power plants. It’s the air pollution created when you burn fossil fuels — a yardstick for measuring how well or how poorly a given area of the world is doing at curbing air pollution.
Today, NASA published its analysis of nine years of global air pollution data taken since the launch of Aura, and it gives us a glimpse of exactly where the worst pollution is coming from. But the heat map-style visualisations created for the study also show us where it’s seen some surprising reductions.
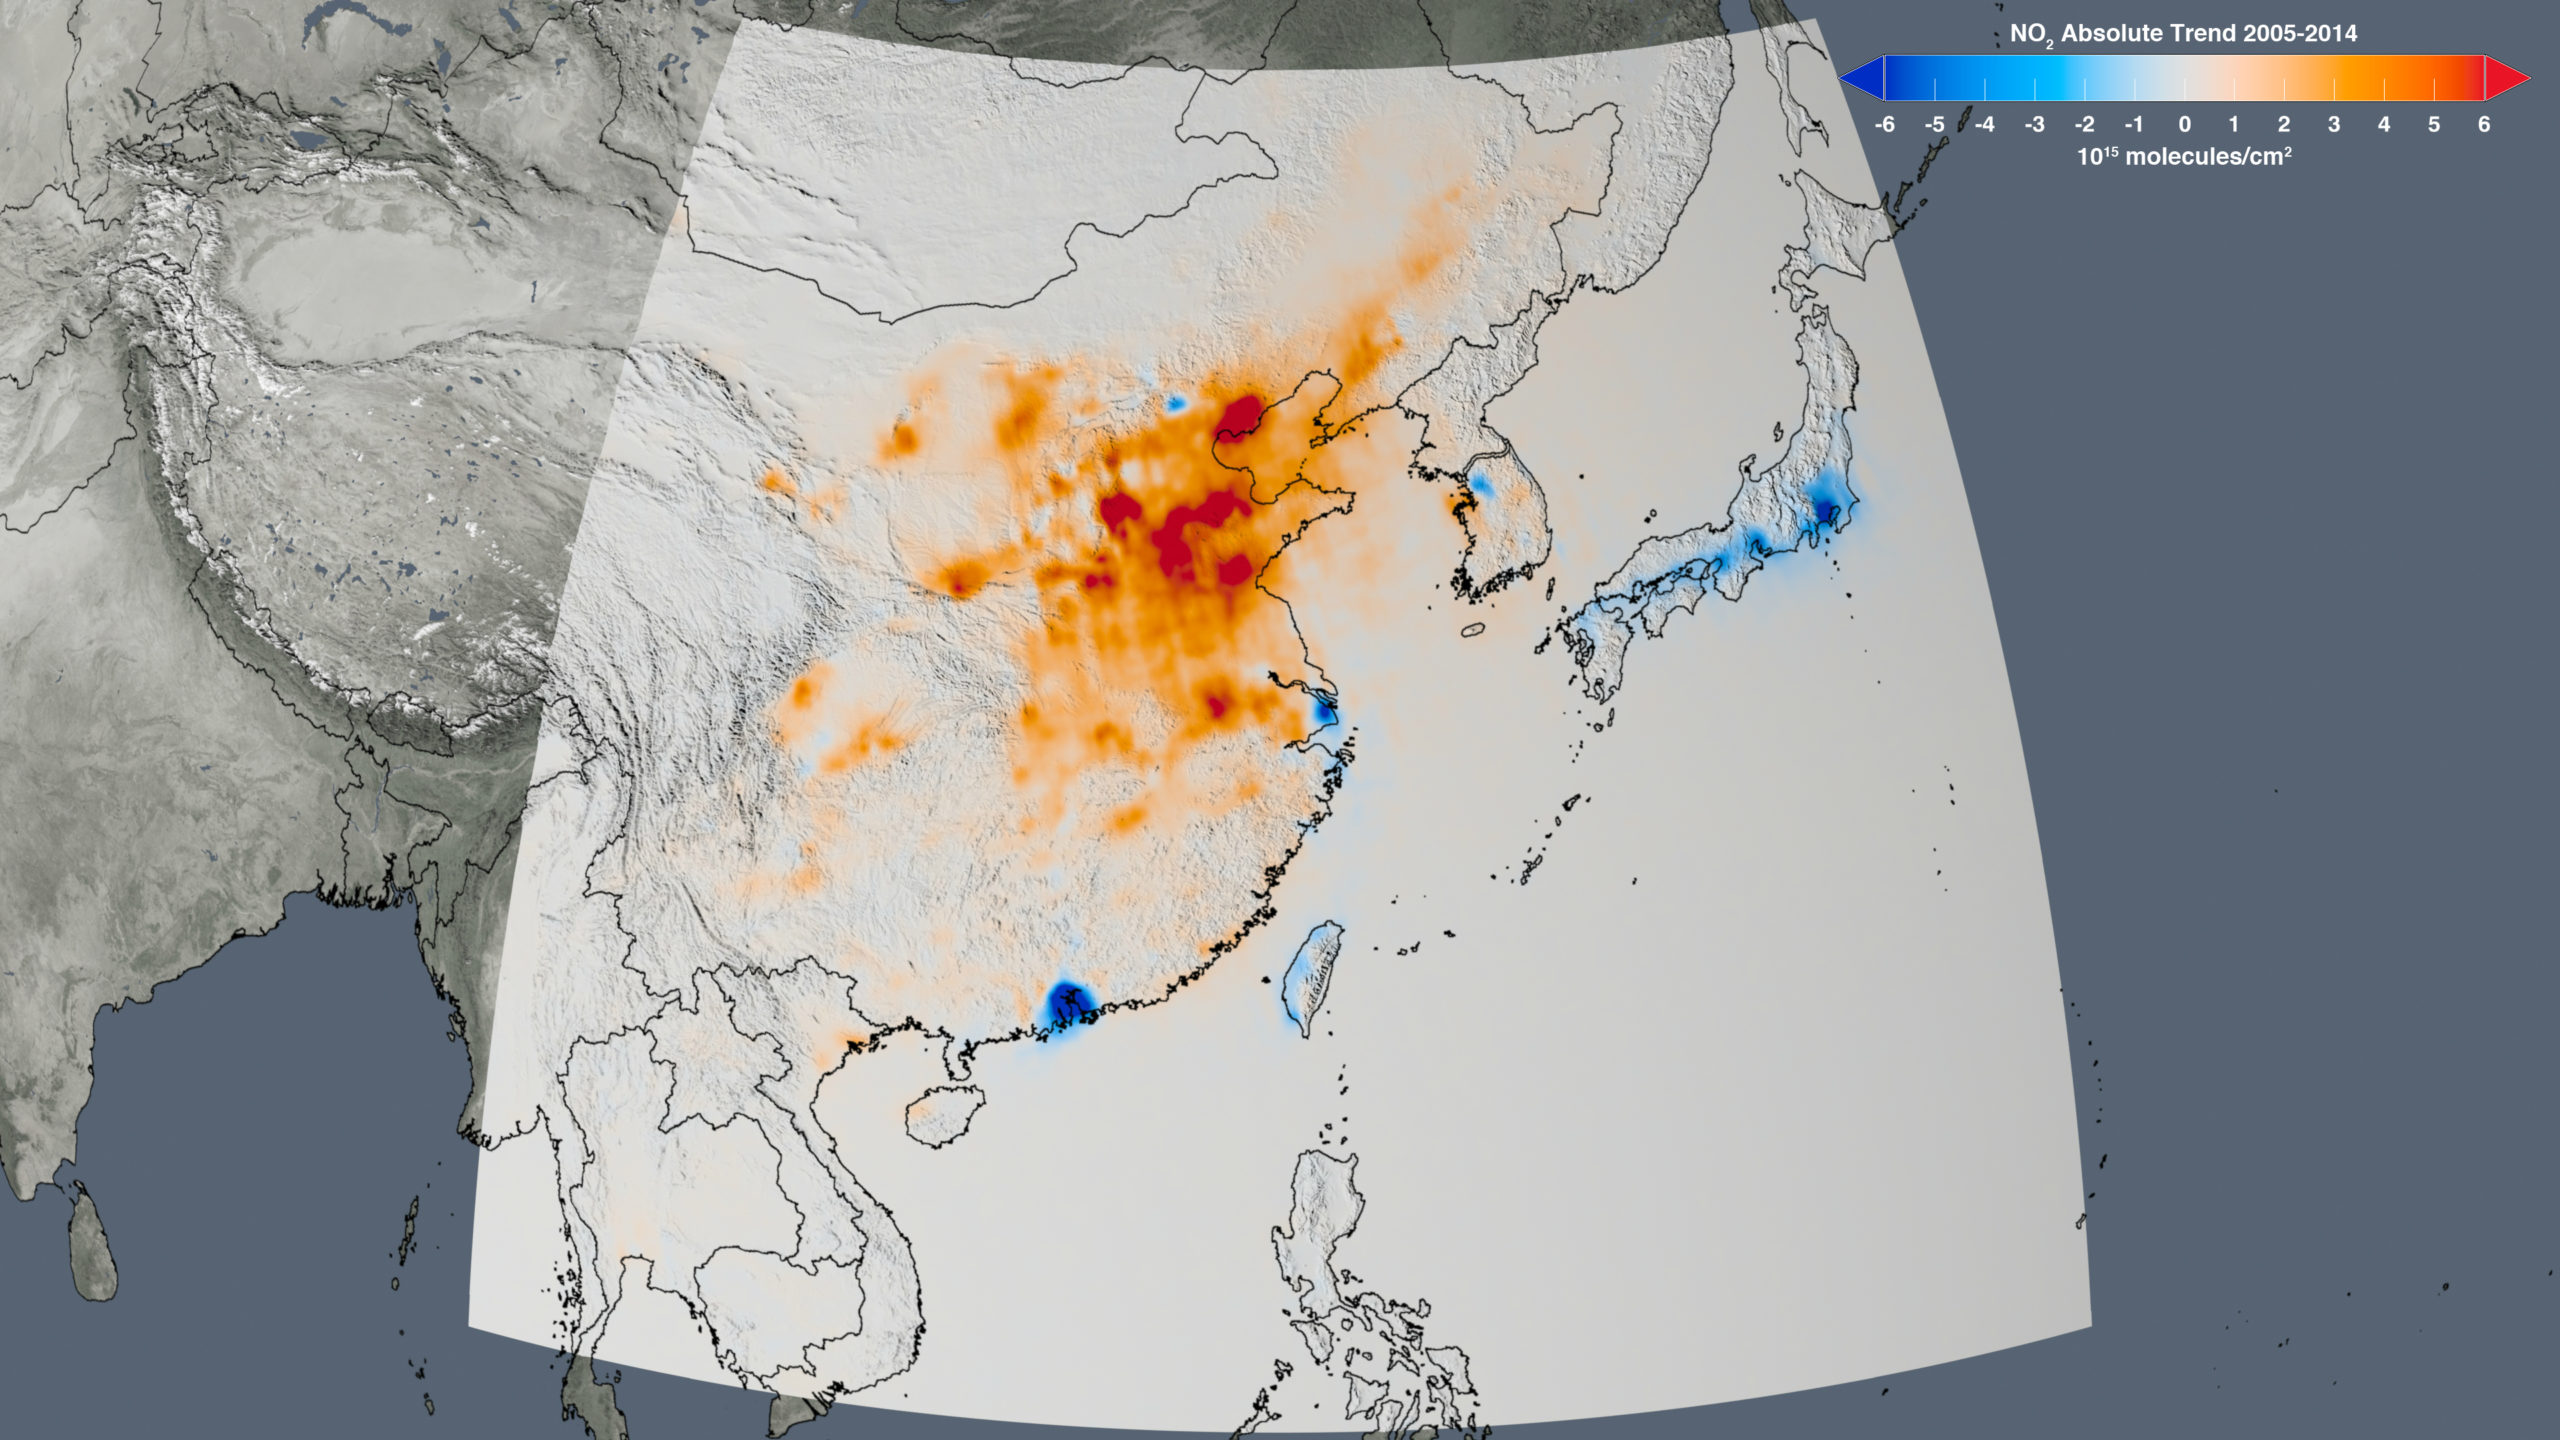
Beijing
Here’s one of the biggest surprises. Beijing is notoriously smog-ridden, yet it’s seen a dramatic decrease according to NASA.
What gives? To put it bluntly, the population Beijing — along with Shanghai, and the Pearl River Delta — have had enough. A “growing middle class is now demanding cleaner air”, explains Bryan Duncan, an atmospheric scientist at NASA. Whereas China overall saw huge increases in air pollution (seen in orange below), cities where citizens are demanding cleaner air saw a decrease overall (seen below in blue).
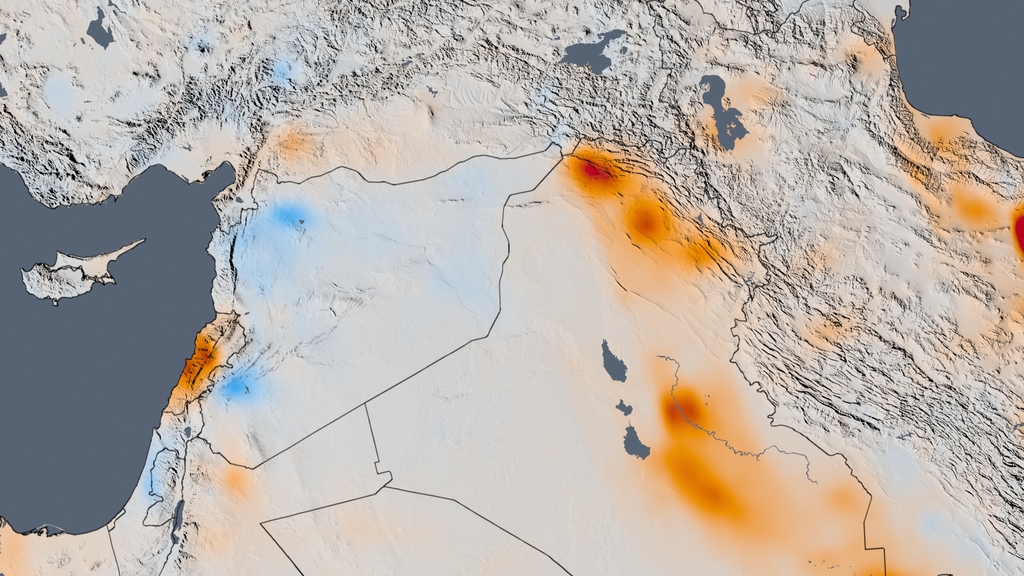
Syria
Duncan points out another aberration: Syria. Whereas other Middle Eastern countries, like Kuwait and Iran, experienced increases, they found something different in Syria. Over the past few years, there was a steep drop off in nitrogen dioxide.
As Duncan explains, that’s due to the double-pronged effect of the civil war there, which crippled the economy and forced millions of people to flee their country. Because most air pollution is caused by economic activity and cars, there’s been a big drop over the past four years.
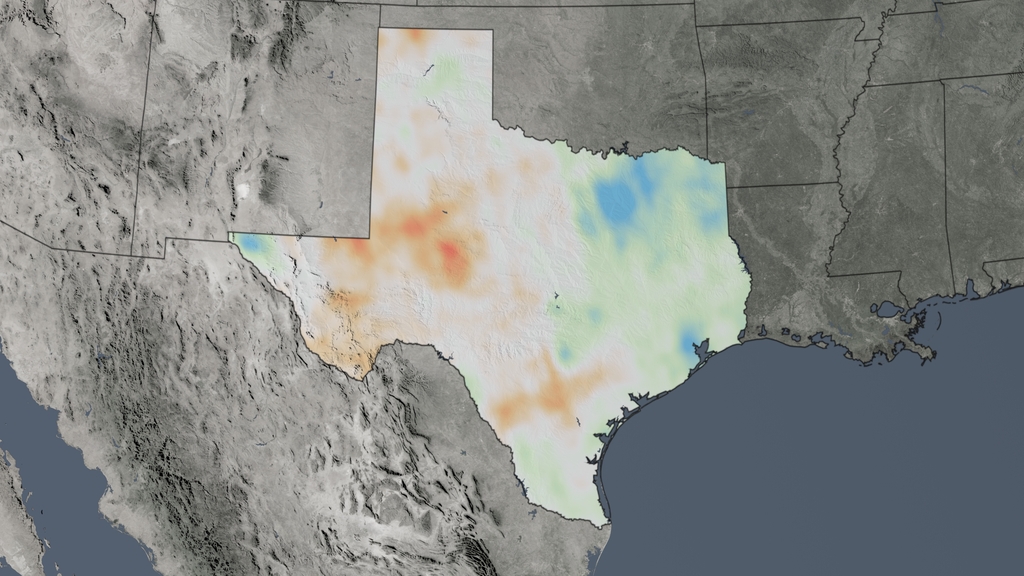
Some (Not All) Parts of Texas
Texas isn’t exactly a winner when it comes to reducing air pollution, but it’s worth checking out its map for another reason. While urban centres like Dallas, Houston, and San Antonio are cloaked in mild blue thanks to attempts at curbing some of the worst air quality readings in the country, much of the rural parts of the state are reddish-orange.
As Duncan points out, Texas and North Dakota are the only states in the union that saw increases in air pollution over this decade — and they were extreme.
The cause is simple: Fracking and other resource extraction projects. Yeesh.
Duncan presented these results at the American Geophysical Union’s annual meeting today, so we’ll probably see more on this data soon. For now, you can check out NASA’s online recap here.