It’s been a very, very tall year. In fact, 2014 actually broke the existing record for the number of skyscrapers completed over a year, with 97 new buildings over 200m tall, including two in Australia. But is that necessarily a sign of health for our economy? Some economists suggest the opposite.
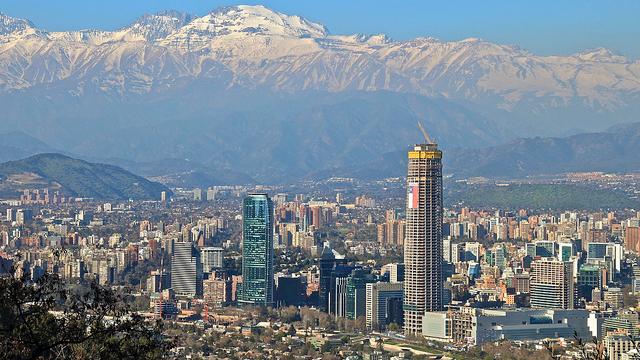
Above: Chile’s Torre Costanera, tied for 10th place on this year’s list of tallest buildings. Picture: Alobos Life/Flickr
The Skyscraper Center just put out its annual Year in Review, analysing the number of tall and supertall buildings that came into being over the past 12 months. The review reports that 2014 was a bang-up year, handily beating the previous record of 81 completions in 2011. Supertall buildings of over 300m also reached a new record with 11 reaching completion, compared to the old record of nine, which has stayed relatively static over the past five years.
One57, the 7th tallest building of the year, under construction in New York City. Picture: Stefan Georgi/Flickr
In Australia, the 72-storey Prima Pearl Apartments in Melbourne and the 81-storey Infinity in Brisbane made the list of buildings completed in 2014.
Melbourne’s Prima Pearl Apartments (left) and Brisbane’s Infinity are respectively ranked 26 and 32 on the list of 2014 Completions. Pictures: laurie.g.w via CTBUH, Fishyone1 via CTBUH
Obviously, analysing the number of completions this year doesn’t account for the fact that none of these buildings was started — or funded — this year. So I dug up the construction start dates of all 97 buildings completed this year, which gives us even more insight to why we’re seeing so many new tall buildings this year:
It’s interesting to see the bump in new construction that happened between 2010 and 2011, as the economy began to show signs of life after the downturn of 2008 (represented here by a particular dearth of new building sites). And the downturn after can be easily enough explained by most of those buildings still being under construction.
Booms and Busts
So it’s been a good year for tall buildings. We’re on a steady upward climb. And in general, that’s good news for the economy (and skyscraper fans). But not all economists agree that more skyscrapers equates to better economic health. In fact, there are some who argue that this very boom is actually foreshadowing for a bust.
The view from Osaka’s Abeno Harukas, tied for 10th place on this year’s list of tallest buildings. Picture: Yasa_/Flickr
In 1999, an economist named Andrew Lawrence published a paper called The Skyscraper Index: Faulty Towers. In it, he showed how major economic collapses frequently occur just after record-breaking skyscrapers are built. And rather than just remark upon the curious timing, he set out a hypothesis for why. Lawrence saw a very simple cause and effect at work: During booms, interest rates go down. The economy gloats, companies expand, and bigger companies necessitate more (and nicer) office spaces. What follows is a construction boom — often in the form of towers — spurred by demand. At a certain point, a peak is reached, and a market over-saturated with empty buildings crashes.
“We took the index as far back as the late 1800s and found that even going back that distance we could still find correlations between economic crises and completion of the world’s tallest building,” said Lawrence in 2012, speaking in an interview with the Council on Tall Buildings and Urban Habitat (PDF).
This year’s crop may not be a death knell for the economy, exactly. As many theorists who have argued the same line of reasoning say, Lawrence’s theory looks at the height of the single record-breaking buildings of the year, not necessarily the quantity of tall buildings completed. If we look at the number of buildings that entered the “top 100” list this year, we see a different pattern:
The biggest boom for tall buildings, seen through this lens, came in 1972 (just before the 1973-75 recession), 2000 (just as the tech bubble burst), 2008 (we all know what happened that year) and 2011. 2014? Meh. In terms of actual record-breaking height for a single building, this year was relatively small potatoes — just look at the report’s little graphic comparing the tallest buildings per year:
This year didn’t see any record-blasting heights — just an unusual number of tall buildings in general. So if we’re going by the Skyscraper Index, which treats record-breaking towers as “caps” to economic booms, we’re not necessarily standing on a precipice.
There are exceptions to the Index too. By his own admission, Lawrence says some towers stand outside of the observed correlation, explaining to the CTBUH again:
But there are exceptions; Taipei 101 for example. Taiwan is very tech-centric in terms of industry base. Taipei 101 did come around at the time of the tech boom. There wasn’t a large global recession in 2001, but there was that whole tech boom slide. I think 101 did provide some indication of what was going on globally.
The Skyscraper Forecast
So how do our prospects — either architectural or economic, depending on much weight you put on the Index — look for the next few years? The report’s authors were able to estimate the upward climb of completions in 2015 and 2016 you see in the graphic above, factoring in average construction time and the number of buildings currently planned or underway:
It seems the quantity of tall buildings will increase — but the list of completions tells us that the tallest, the future Shanghai Tower, will still cower below 2010’s Burj Khalifa by more than 180m.
In the end, trying to divine the exact future of the global economy through a single year of skyscrapers is a little like trying to divine your own future in the dredges of your coffee. But it’s interesting to note — as Lawrence does — that skyscrapers, which began to appear in cities in the last years of the 19th century, have grown up around the modern global economy. Their fates are clearly intertwined.
It’s going to be interesting to watch as the next few years unfold. With fears about another financial crisis always bubbling just below the surface, it’s easy to wonder if the drive to push higher isn’t a little foolhardy.