The Shrinking Of The Arctic Ice In One Simple Graphic

The Shrinking Of The Arctic Ice In One Simple Graphic

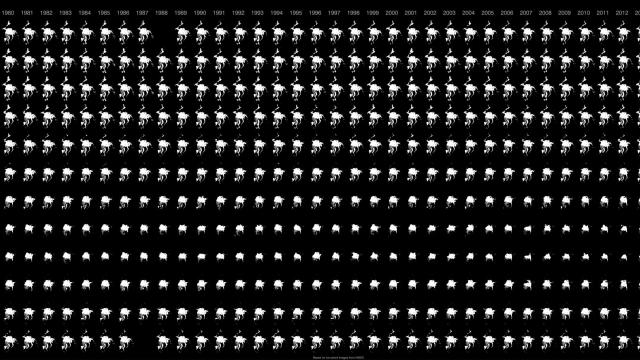
Briefly: NASA’s Greg Shirah made this great grid graphic using images of the north pole sea ice extent from the National Snow and Ice Data Center. From left to right you go from 1979 to 2014. From top to bottom you can see the months. You can see how the spots are smaller every year. Zoom in and scroll.


The Cheapest NBN 50 Plans

It’s the most popular NBN speed in Australia for a reason. Here are the cheapest plans available.

At Gizmodo, we independently select and write about stuff we love and think you'll like too. We have affiliate and advertising partnerships, which means we may collect a share of sales or other compensation from the links on this page. BTW – prices are accurate and items in stock at the time of posting.