News about the drought that has engulfed most of the western United States continues to get worse. But how do we know how extensive the current megadrought is? We actually can measure from the sky, but not in the way you think.
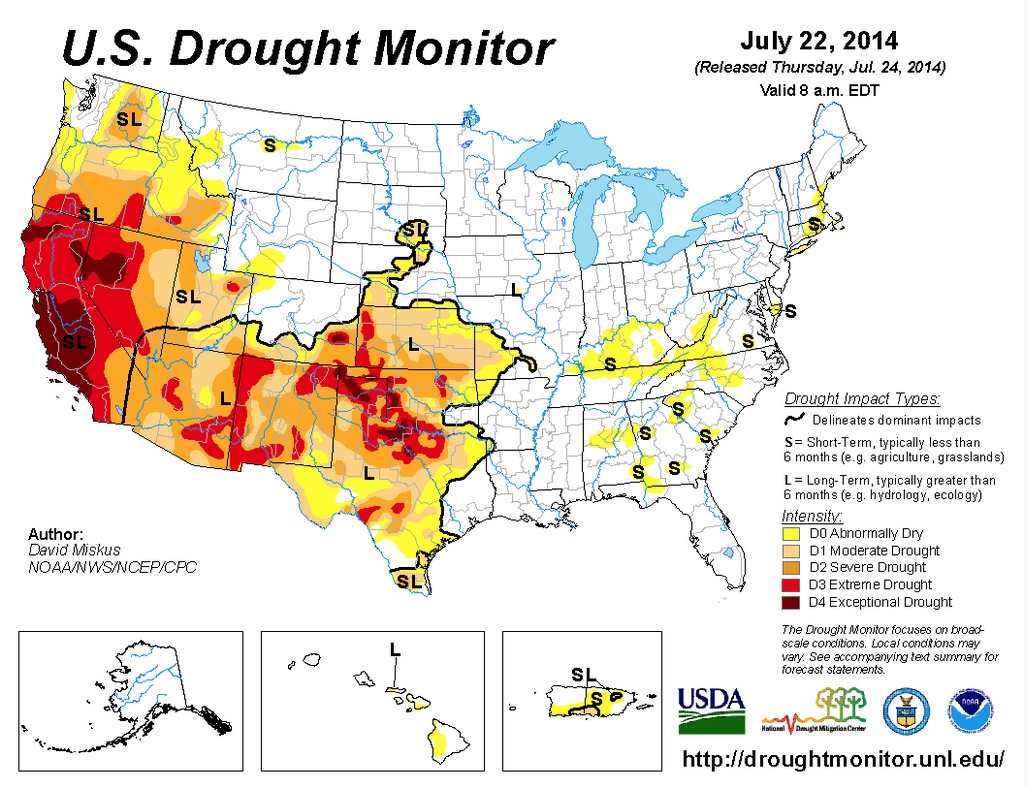
First, let’s recap this week’s bad news. The US Drought Monitor is reporting that “exceptional drought” is covering 33.5 per cent of the US. While conditions are getting better in places like Texas and Oklahoma as they get hit with summer thunderstorms, for much of Nevada and California it’s just going to get drier. California has 82 per cent of the state experiencing “extreme” or “exceptional” drought.
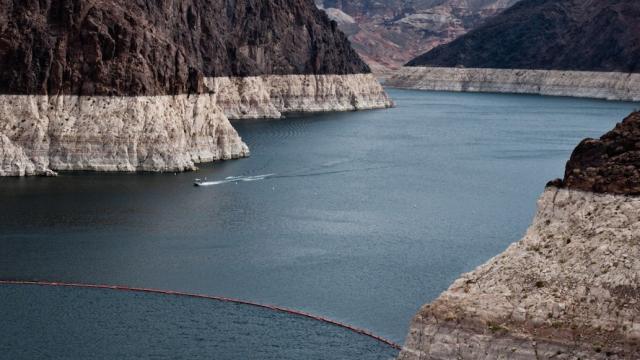
Of course NASA can help to visualise the drought in one very obvious way: The satellite photography of our dramatically shrinking reservoirs and existing snowpack help show how much water we have now and forecast how much water we can expect to have at summer’s end.
But there’s actually another, more important way to measure the drought: By looking at groundwater. One of the largest underground water reserves in the country is found around the Colorado River Basin, which supplies much of the most-parched areas of Nevada and California with their water.
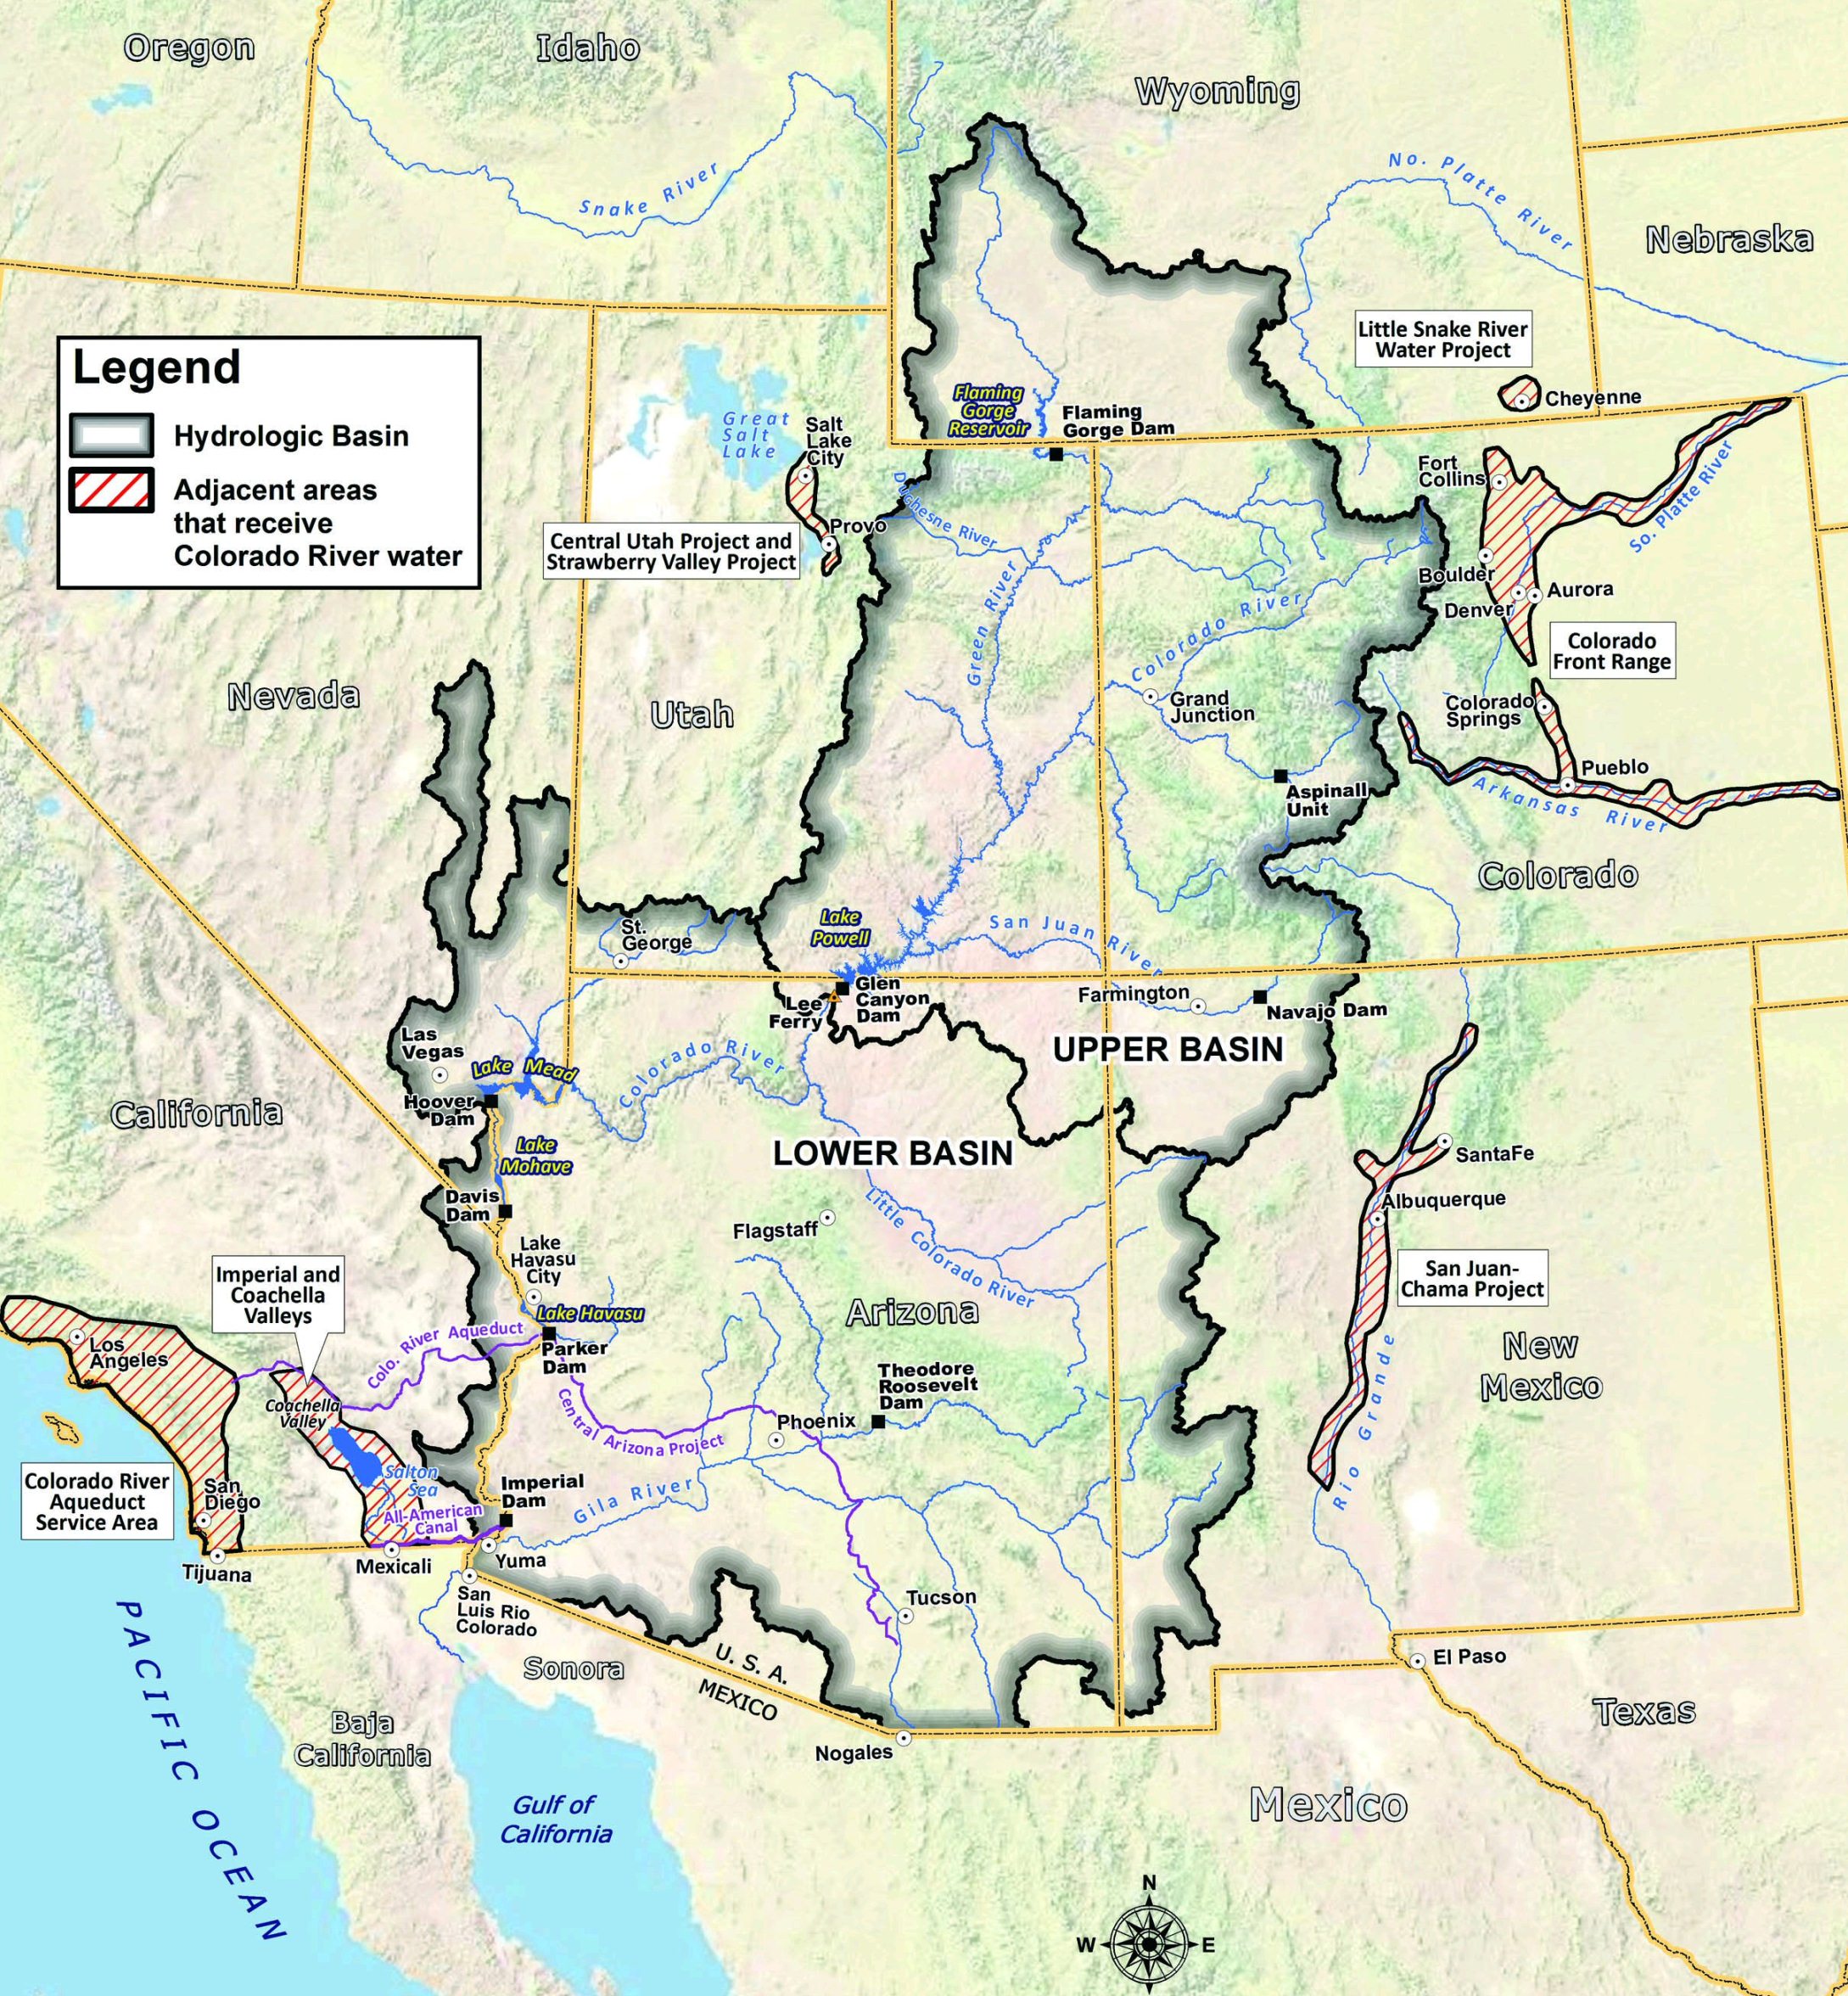
The wells which dot the West pull data about how much water is below, but the system is not extensive enough to give a complete picture. But using the Gravity Recovery and Climate Experiment (GRACE) satellite, NASA can actually measure changes in groundwater, both above and below the surface.
“There’s only one way to put together a very large-area study like this, and that is with satellites,” said Jay Famiglietti, senior water cycle scientist at JPL who is currently at UC Irvine. As Famiglietti describes it, GRACE is like a scale in the sky. The amount of water in a specific region changes the area’s mass which in turn influences its gravitational attraction. GRACE measures that regional gravity and can demonstrate if the amount of water is increasing or decreasing, and by how much. The same satellite can measure ice depletion in the polar regions, predict flooding, and even help discover unknown underground water reserves.
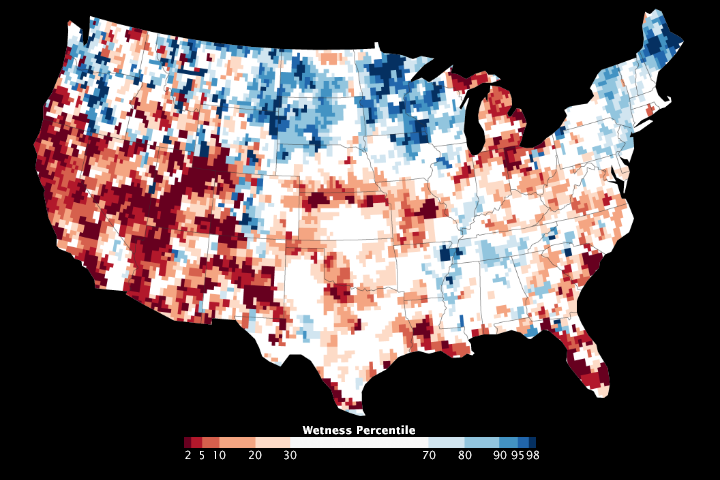
“Wetness” or water content, in this map is a depiction of the amount of groundwater on July 7, 2014, compared to the average from 1948 to 2009
Scientists use GRACE’s data alongside other indicators to give a “wetness” rating for the country. Unfortunately, the groundwater report is also not good for the West. Measurements show that the Colorado River Basin has lost 53 million acre feet since 2004, with about 41 million acre feet lost from groundwater.
The ability to look underground paints what might be the most accurate picture we have of the drought. It’s also very bleak one, as the Colorado-fed Lake Mead is already at its lowest levels ever — so low that Nevada has mounted a NASA]
Picture: US Bureau of Reclamation