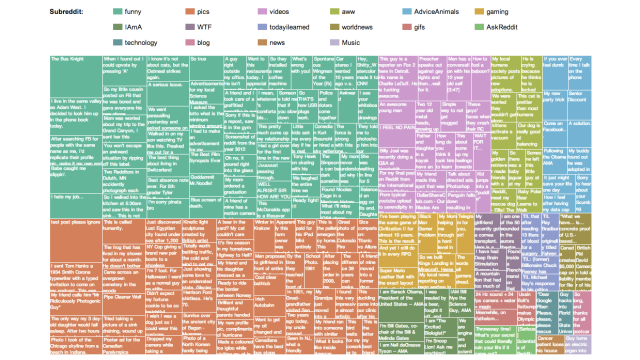
There have been a mind-boggling number of posts on Reddit since it was created, but which ones have done best? This visualisation shows the 200 highest-scoring posts of all time from the site.
In fact, this visualisation is a tree map: a means of data presentation where the area is recursively subdivided into rectangles, and the area of each one corresponds to its value. So in this case, the area of each rectangle represents the score the post got on Reddit.
You’re probably straining your eyes right now though, so it’s probably best go go explore this interactive version, which allows you to click through to the post in each case too. Sorry in advance for wasting your morning. [Visua.ly]