Back in the 1990s, Ben Shneiderman invented the treemap as a means of visualising the hierarchical contents of his hard drive. Now, he’s taking inspiration from famous artists to make his data look pretty. Really, very pretty.
The idea is to use the stylistic cues of famous artists to generate visualizations that represent the data set accurately while also looking wonderful. He explains:
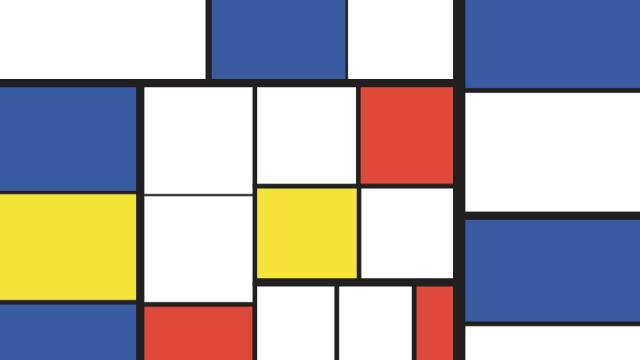
Coloured rectangular regions have been a popular theme in 20th century art, most notably in the work of Piet Mondrian, whose work was often suggested to have close affinity with treemaps. Not all his designs are treemaps, but many are. His choice of colours, aspect ratios, and layout are distinctive, so simulating them with a treemap is not as trivial as you might think. Gene Davis’ large horizontal paintings with vertical stripes of many colours were more easily generated with treemap layouts. The rectangles in Josef Albers “Homage to the Square” or Mark Rothko’s imposing paintings are not treemaps, but generating treemap variants triggered further artistic explorations. Other modern artists such as Kenneth Noland, Barnett Newman, and Hans Hofmann gave further provocations to the images in this collection.
You can take a look at some of his draft designs over at Tree Map Art — but our favourite is definitely this Mondrian-themed effort. [Tree Map Art via Flowing]