In the study of natural disasters — be they tornadoes, hurricanes, snowpacolyses or Florida on a weekday — the event’s magnitude is just as vital to our understanding as its duration and frequency. Hurricanes and tornadoes are measured by class, blizzards along the Winter Wonderland-Killstorm demarcation. Earthquakes, of course, are measured by how much energy they release — a system better known as the Richter Scale.
How It Works
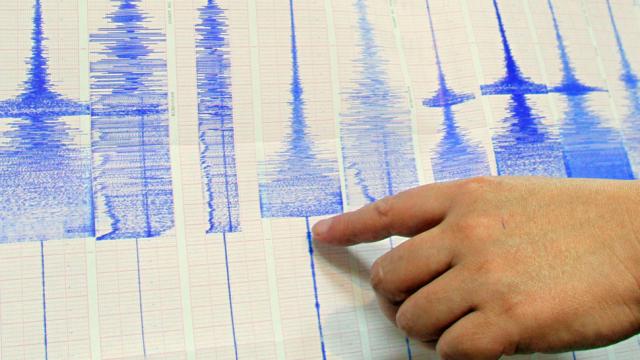
Officially known as the Richter magnitude scale, the Richter scale is used to measure the strength of a quake and assign it a single quantifiable number indicating its relative magnitude. The system operates on a base-10 logarithmic scale, measuring the amplitude of seismic waves recorded upon a seismograph. Basic seismographs, or seismometers, use a dampened inertial mass held in place relative to the rest of the instrument (think: a hanging pendulum, suspended over a recording surface). This weight is less likely to move when the ground trembles on account of its inertia so seismologists can measure the motion of the ground by comparing the movement of the frame versus the weight along three axis — North-South, East-West and vertical.
Being logarithmic, each incremental number on the scale denotes a 10x increase in magnitude — that is, a shaker measuring 5.0 on the Richter Scale is 10 times larger, and releases 31.6 times as much kinetic energy, as one measuring 4.0. A quake doubles in strength every 0.2 increment. For reference, a 1.0 seismic wave is about as strong as detonating six ounces of TNT, an 8.0 seismic wave is about as strong as detonating 6,000,000 tons of TNT.
Richter’s Scale
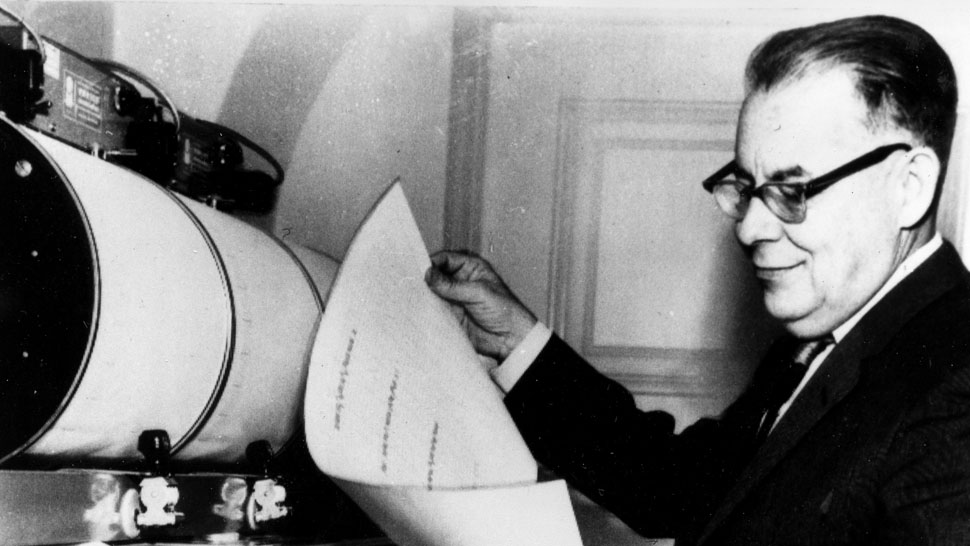
The dawn of the 20th Century was an exciting and terrifying time for seismology. The same year that Richard Dixon Oldham first identified the independent parts of an earthquake — P-waves, S-waves and surface waves — was the same year that an 8.0 leveled most of San Francisco. Just four years later, Harry Fielding Reid laid the foundation for modern tectonics with his “elastic rebound theory” based on his study of the San Francisco quake. And in 1935, Charles Richter and Beno Gutenberg of the California Institute of Technology, devised a means of measuring an earthquake’s intensity: the local magnitude scale (ML).
The pair developed the ML scale to measure medium-strength earthquakes in Southern California, near the university campus, and compare their relative magnitudes. The scale rated magnitudes by the logarithm of the amplitude of waves recorded by (and only by) Wood-Anderson seismographs 100kmfrom the epicentre. Richter assigned the scale baseline (Magnitude 0) as any event that caused the seismographs needle to move 1µm laterally along the seismogram. Quakes need to be roughly 1000 times that powerful, registering Magnitude 3 (480 kg of TNT), for people to even notice, 10,000 times that (Magnitude 5) to cause significant damage, and 10,000,000 times that (Magnitude 7 – 480 kilotons of TNT) to be considered a major earthquake. The largest ever, the 9.5 that hit Valdivia, Chile with 950,000,000 times that force (equivalent to 2.7 gigatons of TNT) in 1960, killing 1900 and causing $US4 billion in damages.
Since the ML scale was really only designed to study the local Southern California quakes, there are limitations to what it can measure. On the lower end, Magnitude 0 was set specifically to prevent the system from returning negative magnitude results. However, more-sensitive modern equipment can detect microquakes small enough to register negative values. The upper end of the scale is also limited. Since the system was built to study quakes between Mag 3 to 7, all sufficiently large shakers register about 7.0, regardless of their actual energy output. What’s more, the system is limited by a maximum distance to the epicentre — readings beyond 600 km simply aren’t strong enough to provide a reliable magnitude estimate — and by the length of the impacted fault line — quakes that broke along 1000km fault lines like the the 1952 Aleutian Fox Islands quake and the 1960 Chilean, were simply too big to be accurately characterised.
Despite these drawbacks, the Richter scale provides an agnostic measure of earthquake strength and provides a rough comparison of its impact — one that doesn’t rely on eyewitness testimony or vary depending on soil composition and architecture as the earlier Mercalli system, devised by Italian volcanologist, Giuseppe Mercalli in 1902, did. The ML scale allowed for the development of stronger building codes. For example, you won’t find an un-retrofitted brick foundation within San Francisco city limits anymore. And even as refinements to the scale system have surpassed it in accuracy, the original ML scale remains the most widely-known version and is regularly used to calculate a tremor’s severity immediately following quake.
Improvements to the Scale
By the 1970s, our understanding of seismology had advanced enough for Richter and Gutenberg to rethink the local scale system. The pair devised a new Ms magnitude scale based on both surface waves, seismic waves that move like rippling water along the surface, and mb for body waves, those that move through the Earth’s interior. Since both of these waves can be measured from more than 100km from the epicentre, neither method is distance-limited as the original ML scale though they are adjusted to provide consistent results with the earlier form.
These scales were not perfect, they both top out at Magnitude 8, hence the development of the Moment Magnitude scale, Mw. While most people mistakenly refer to it as the Richter scale, the Moment Magnitude scale is based on a different tectonic theory — that of elastic dislocation, first put forth by F. A. Dahlen in 1972, which posits that the energy released by a tremor is proportional to the surface area that breaks free, the average distance of displacement (how far the fault moves) and the structure of the ground surrounding the faultline. That is, the magnitude is derived from the rigidity of the Earth times the average amount of fault slip times the amount of area that moved. This system was based on years of seismic readings and marked a huge advancement in our understanding of seismology. The USGS (US geological Survey) now measures all large earthquakes using the MMS scale.
[Wikipedia, Wikipedia, Wikipedia, howstuffworks, Michigan Tech, Britannica, USGS]
Pictures: AP, Jorg Hackemann/Shutterstock, US State Dept